
Activity Cost Tracking Module
Cost Module
The IRIS Cost module is used by Project Managers and is design to help when calculating and visualizing the daily cost or cost to date associated with an Activity, as well as estimating the remaining costs of the Activity to completion.
The 'Cost and Scheduling' module is accessed using the Currency tab and the portal will appear in the left hand section of the screen.
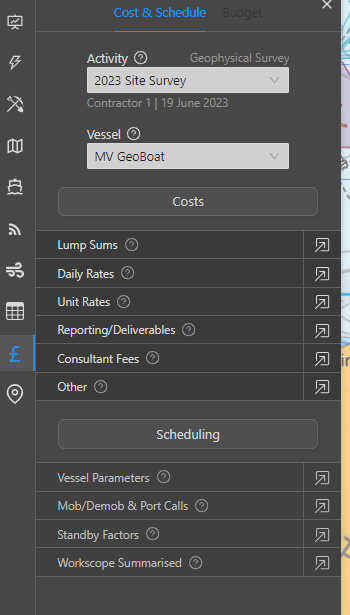
Within the module an Activity and a Vessel are selected before values can be added. This allows for cost tracking across an multiple activities and vessels at any one time.
The costs associated with the activity are separated in to Cost Categories: Lump Sum, Daily Rates, Unit Rates, Reporting and Deliverables, Consultant Fees, Other and Summary. These allow for all costs associated with an activity to be accounted for and allows for better tracking of running costs.
To access the tables associated with the Cost Categories, press the box arrow symbol next to the category necessary. Once expanded you can move through the categories using the tabs along the top of the table.
Each table is separated into 4 sections: Client information, Planned, Actual (to date) and Forecast (Remaining). Planned section is the proposed budget that has been allocated prior to the jobs start date and will be filled in by the Project Manager. Actual (to Date) is the 'running costs' reported throughout the project. These can be input manually or can be automated (orange tick box) in which the data will be extracted from the Data Entry section completed by the client reps using the DPR codes provided. The Forecast (Remaining) is then calculated as the Planned budget minus the Actual. These again can be automated using the orange tick boxes at the end of the Actual and Forecasted data and layers can be excluded from the totals if needed.
Lump Sum
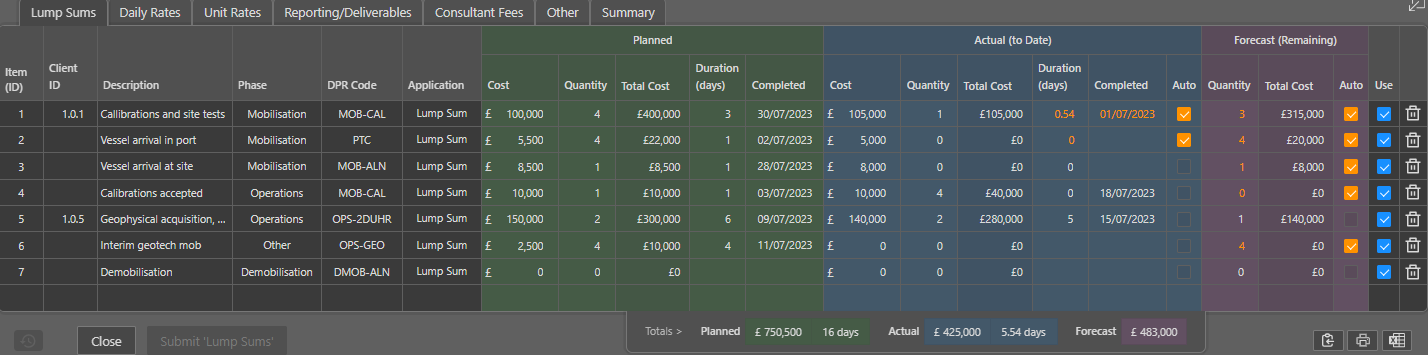
This is where individual values of all applicable lump sums or singular payments can be added. They may refer to a specific phases of an activity such as Mobilization, Demobilization or Operations and can be allocated a Client ID, phase and DPR code. Within the Planned data section, the Cost and Quantity values need to be imputed for each row to allow for a total cost to be calculated. This section also allows for the proposed duration and completion date to be added. The Actual data section allows for the changes in proposed Costs and Quantity to be added and a Actual Total cost to be calculated. The Duration and Completion Date can be added manually or can be Automated, and collected from the Data Entry module. The Forecast section included the remaining Quantity to be entered and a Total Remaining Cost to be calculated. This again can be automated to use the data from the Data Entry module and the table.
Daily Rates
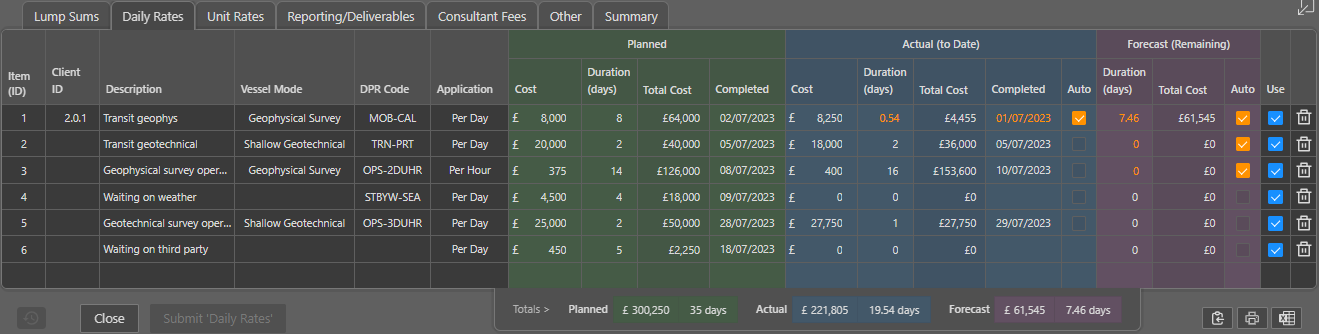
In this table any continued rates associated with operational activities typical for data acquisition and are often linked to DPR codes, Vessel mode and a Client ID. Within the Planned data section, the Cost and Quantity values need to be imputed for each row to allow for a total cost to be calculated. The proposed duration and completion date are also needed in order to compare to the Actual data. The Actual and Forecasted follow the same layout as the Lump Sum table and can be partially automated using the data provided within the Data Entry module.
Unit Rates
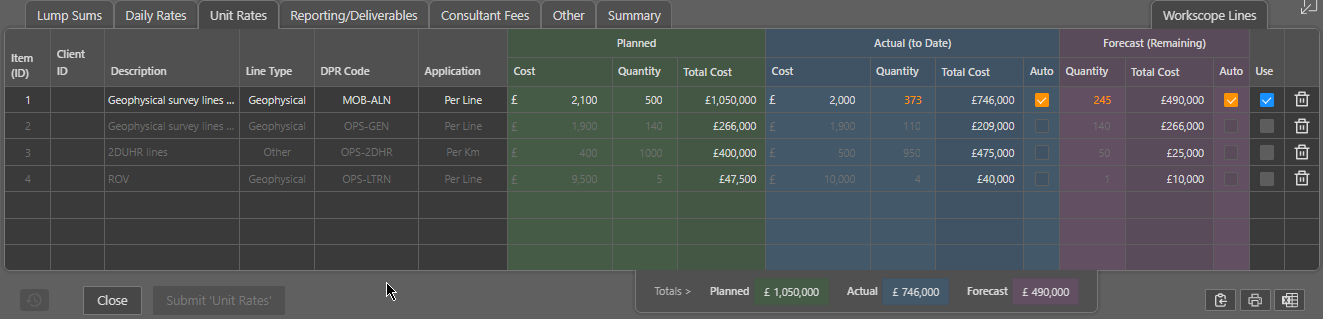
This refers to specified rates associated with individual items of the workscope for data acquisition such as lines, locations, zones or routes. The table is dependent on the workscope type of the Activity selected and will be shown through the tabs on the upper right of the table. If an activity includes multiple workscope, then multiple tables are created and can be tabbed through using the tabs in the right-hand corner of the table. Each row can be allocated a Client ID, Description, the Type and a DPR code as well as an Application such as Per Hour or Per Day. Within the Planned section, the Cost and Quantity is added to calculate the Proposed Total Cost. This is then replicated across the Actual and Forecasted data in a similar way to previous categories. This section doesn't require any dates to be allocated.
Reporting/Documenting
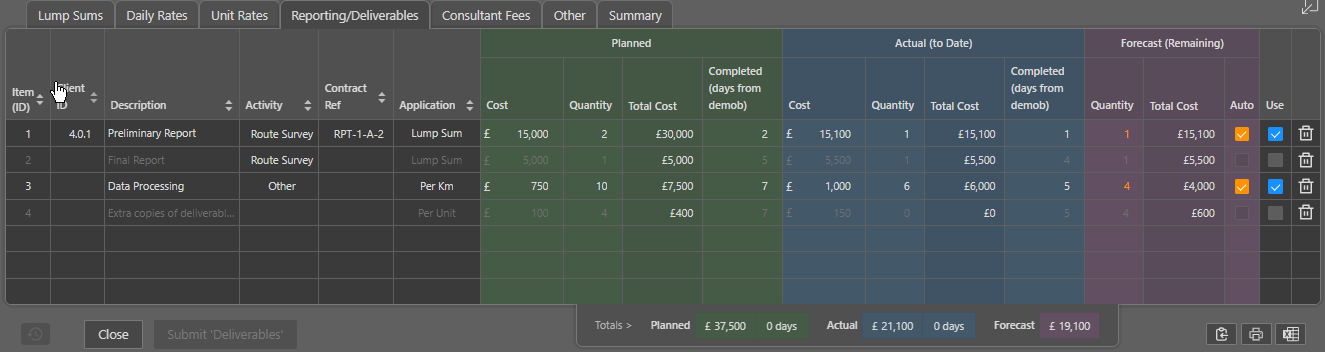
This table allows for the inclusion of the costs associated with reporting, interpretation, processing and deliverables. This section doesn't include DPR codes and instead can be allocated to an Activity with a Contract Reference, an Application and a Description. Within the Planned data, the Cost and Quantity is filled in to produce a Proposed Total Cost. An additional column is Completion, which tracks the number of days this need post demobilization. This layout is repeated within the Actual data and this cannot be automated, as this workscope is regularly completed post data collection an is not included in the Data Entry module. The Forecasted section can be Automated and will calculate the remaining quantity and Total cost from the data provided within the table.
Consultant Fees
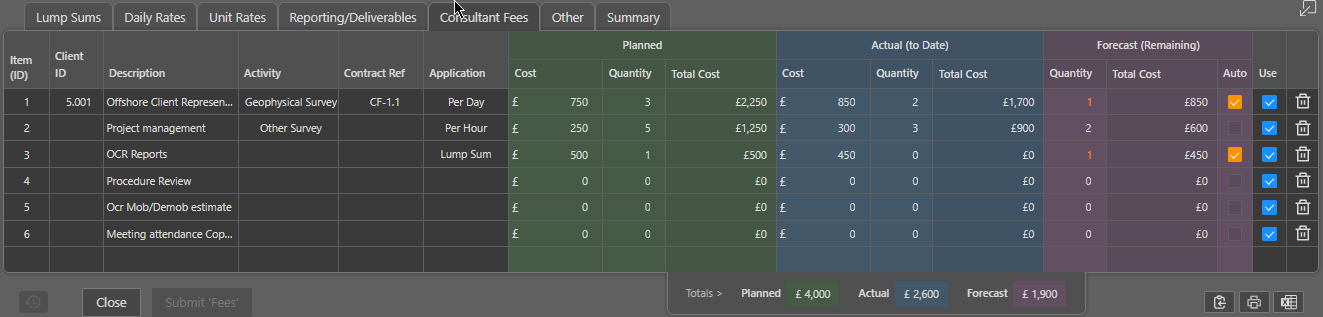
This allows for the inclusion of costs associated with the employment of OCRs and third-party project management. A row will contain a Description of the cost, the Client ID, the Activity and the Application (lump sum, per Day etc.). Across the Planned, Actual and Forecasted sections, only the Cost and the Quantity is needed and Cannot be Automated apart from the Forecasted data. This will calculated the remaining difference between the provided Planned and Actual data.
Other
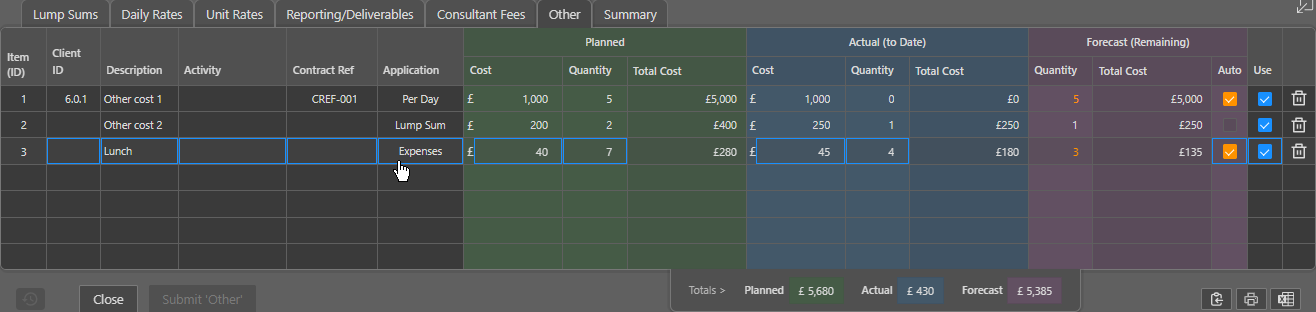
Here any additional costs for items mot previously described can be added and will follow the layout for Consultation fees as described above.
Once a section has been filled in, it needs to be submitted using the blue button at the bottom of the table.
Summary
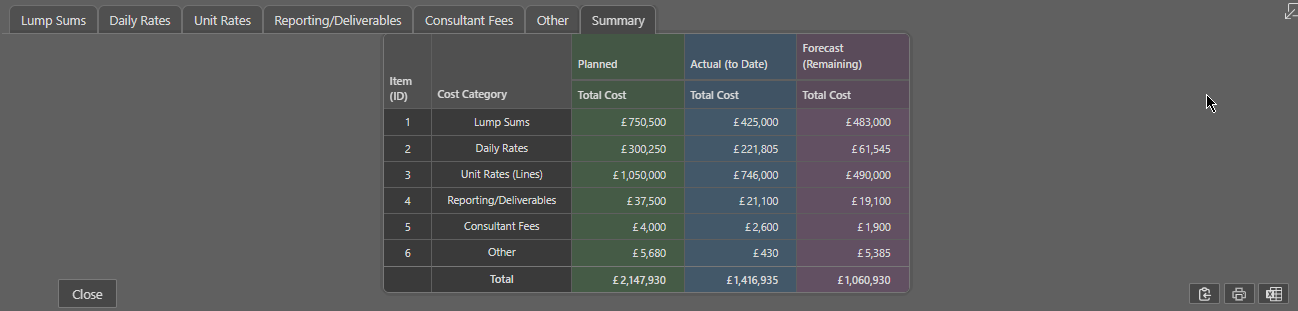
The final Summary tab of the Costs table shows the inputted planned budget, the Actual running costs and the estimated remaining forecast for each Cost Category as well as in total.
All of the tables can be copied or exported in an excel format for further analysis.