Subsea Cable and Pipeline Risk Manager
Risk Manager
The Risk manager allows you to generate and visualise risk bar for linear assets using raw and supplied results data to assess and compare th risk along each feature for a defined KP range. These can also be weighted and combined into a single risk profile for display on the Asset Data Dashboard and on the Map Window.
The overall aim is to identify and combine risk factors such as depth of burial, exposures, spikes in vehicle sensors and dense fishing areas to understand where faults may arise or why faults have occurred. This can help plan target areas for protective works.
Creating a Risk Bar
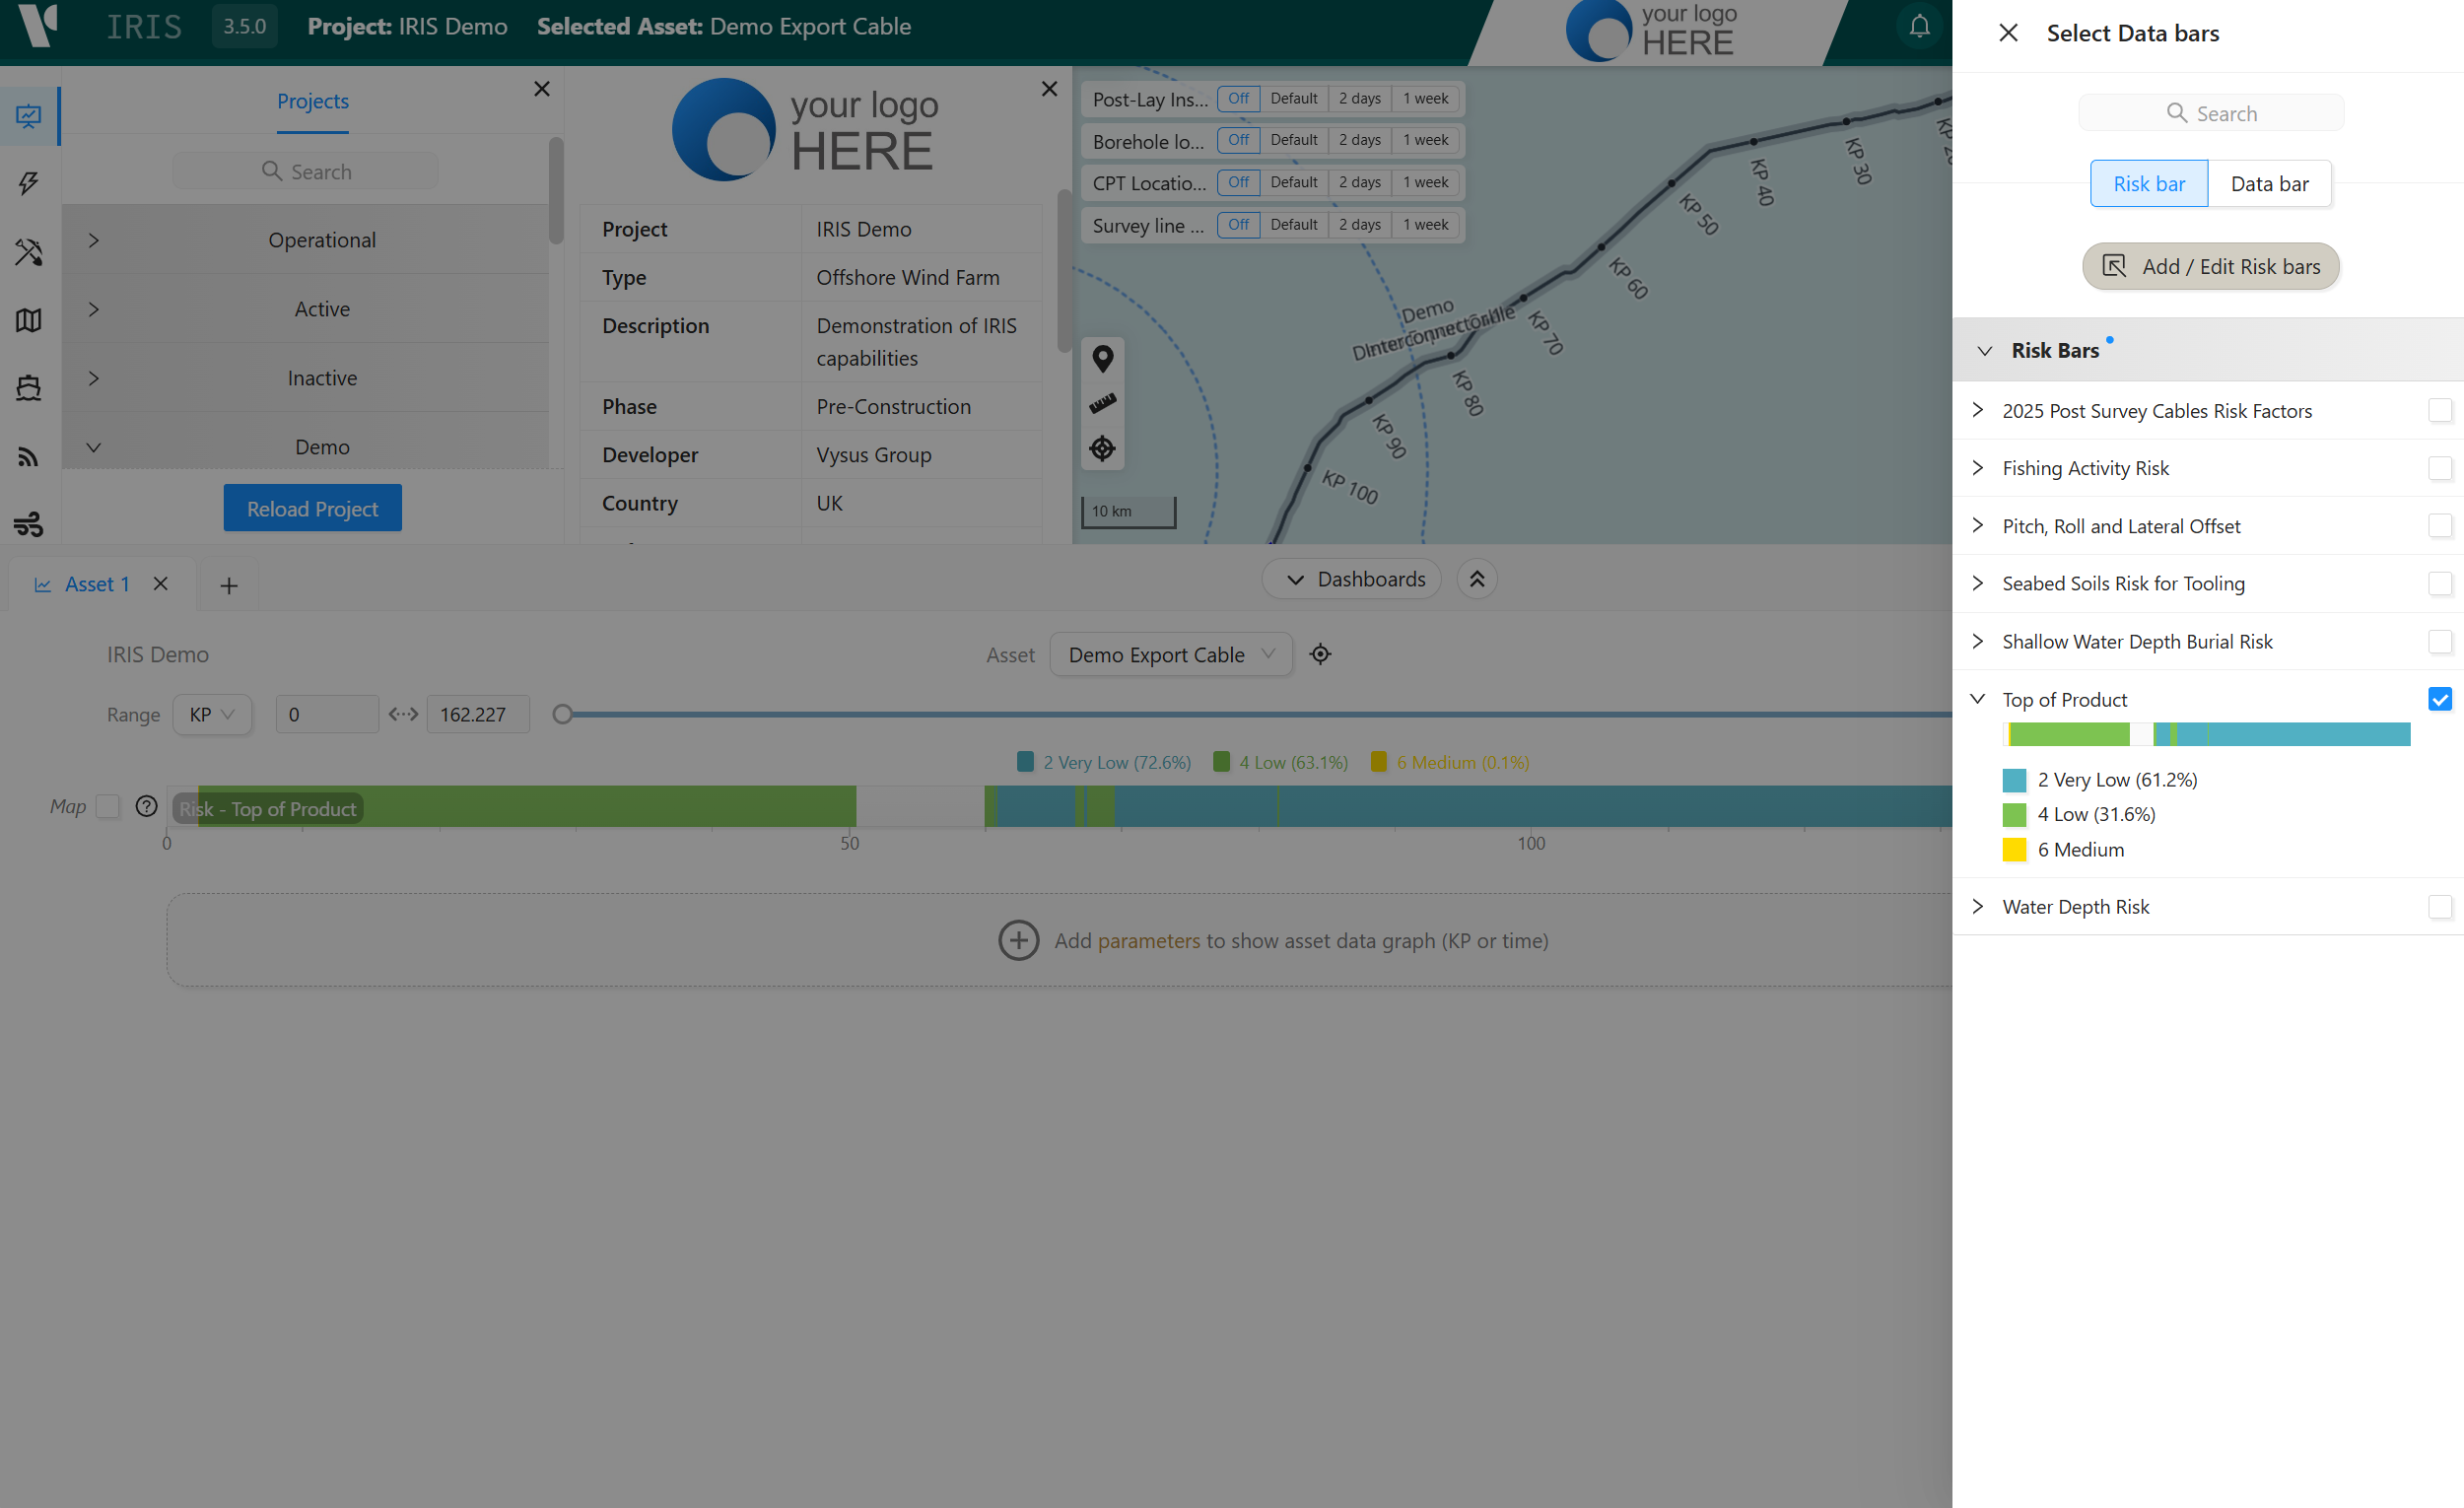
The Risk manager is located within the Asset Data Dashboard which can be access through the dashboard tablet selector at the bottom of the window.
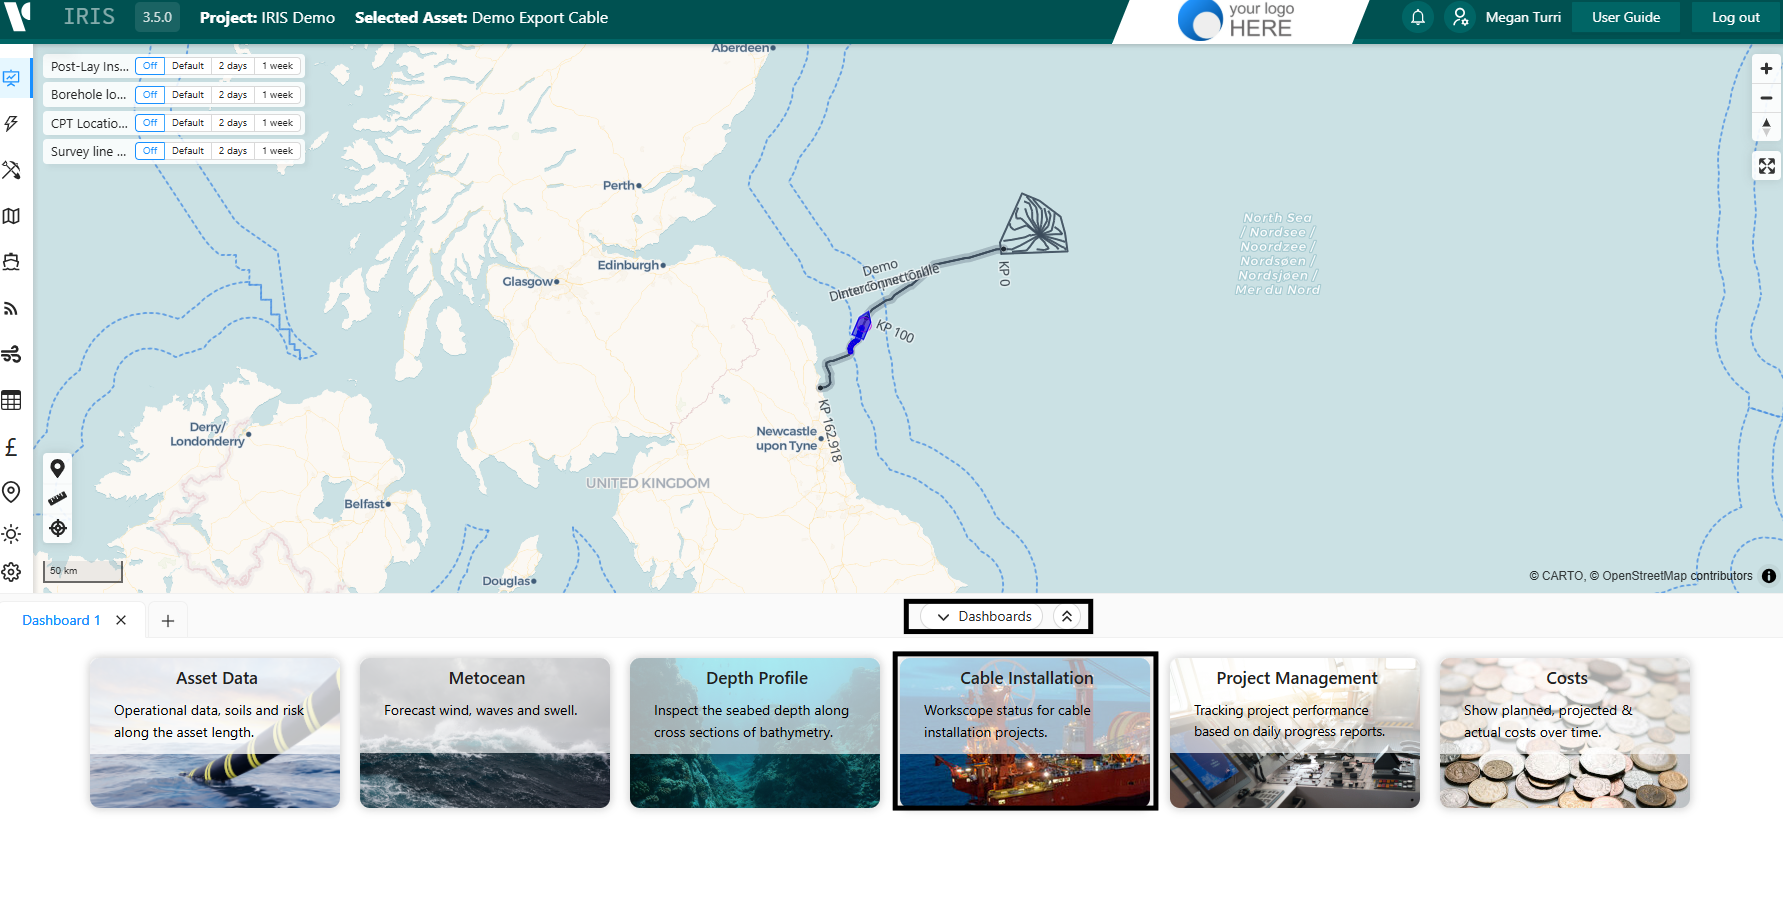
To add data select the Asset in the drop-down at the top of the dashboard or through the Assets Module, before changing the KP range if needed.
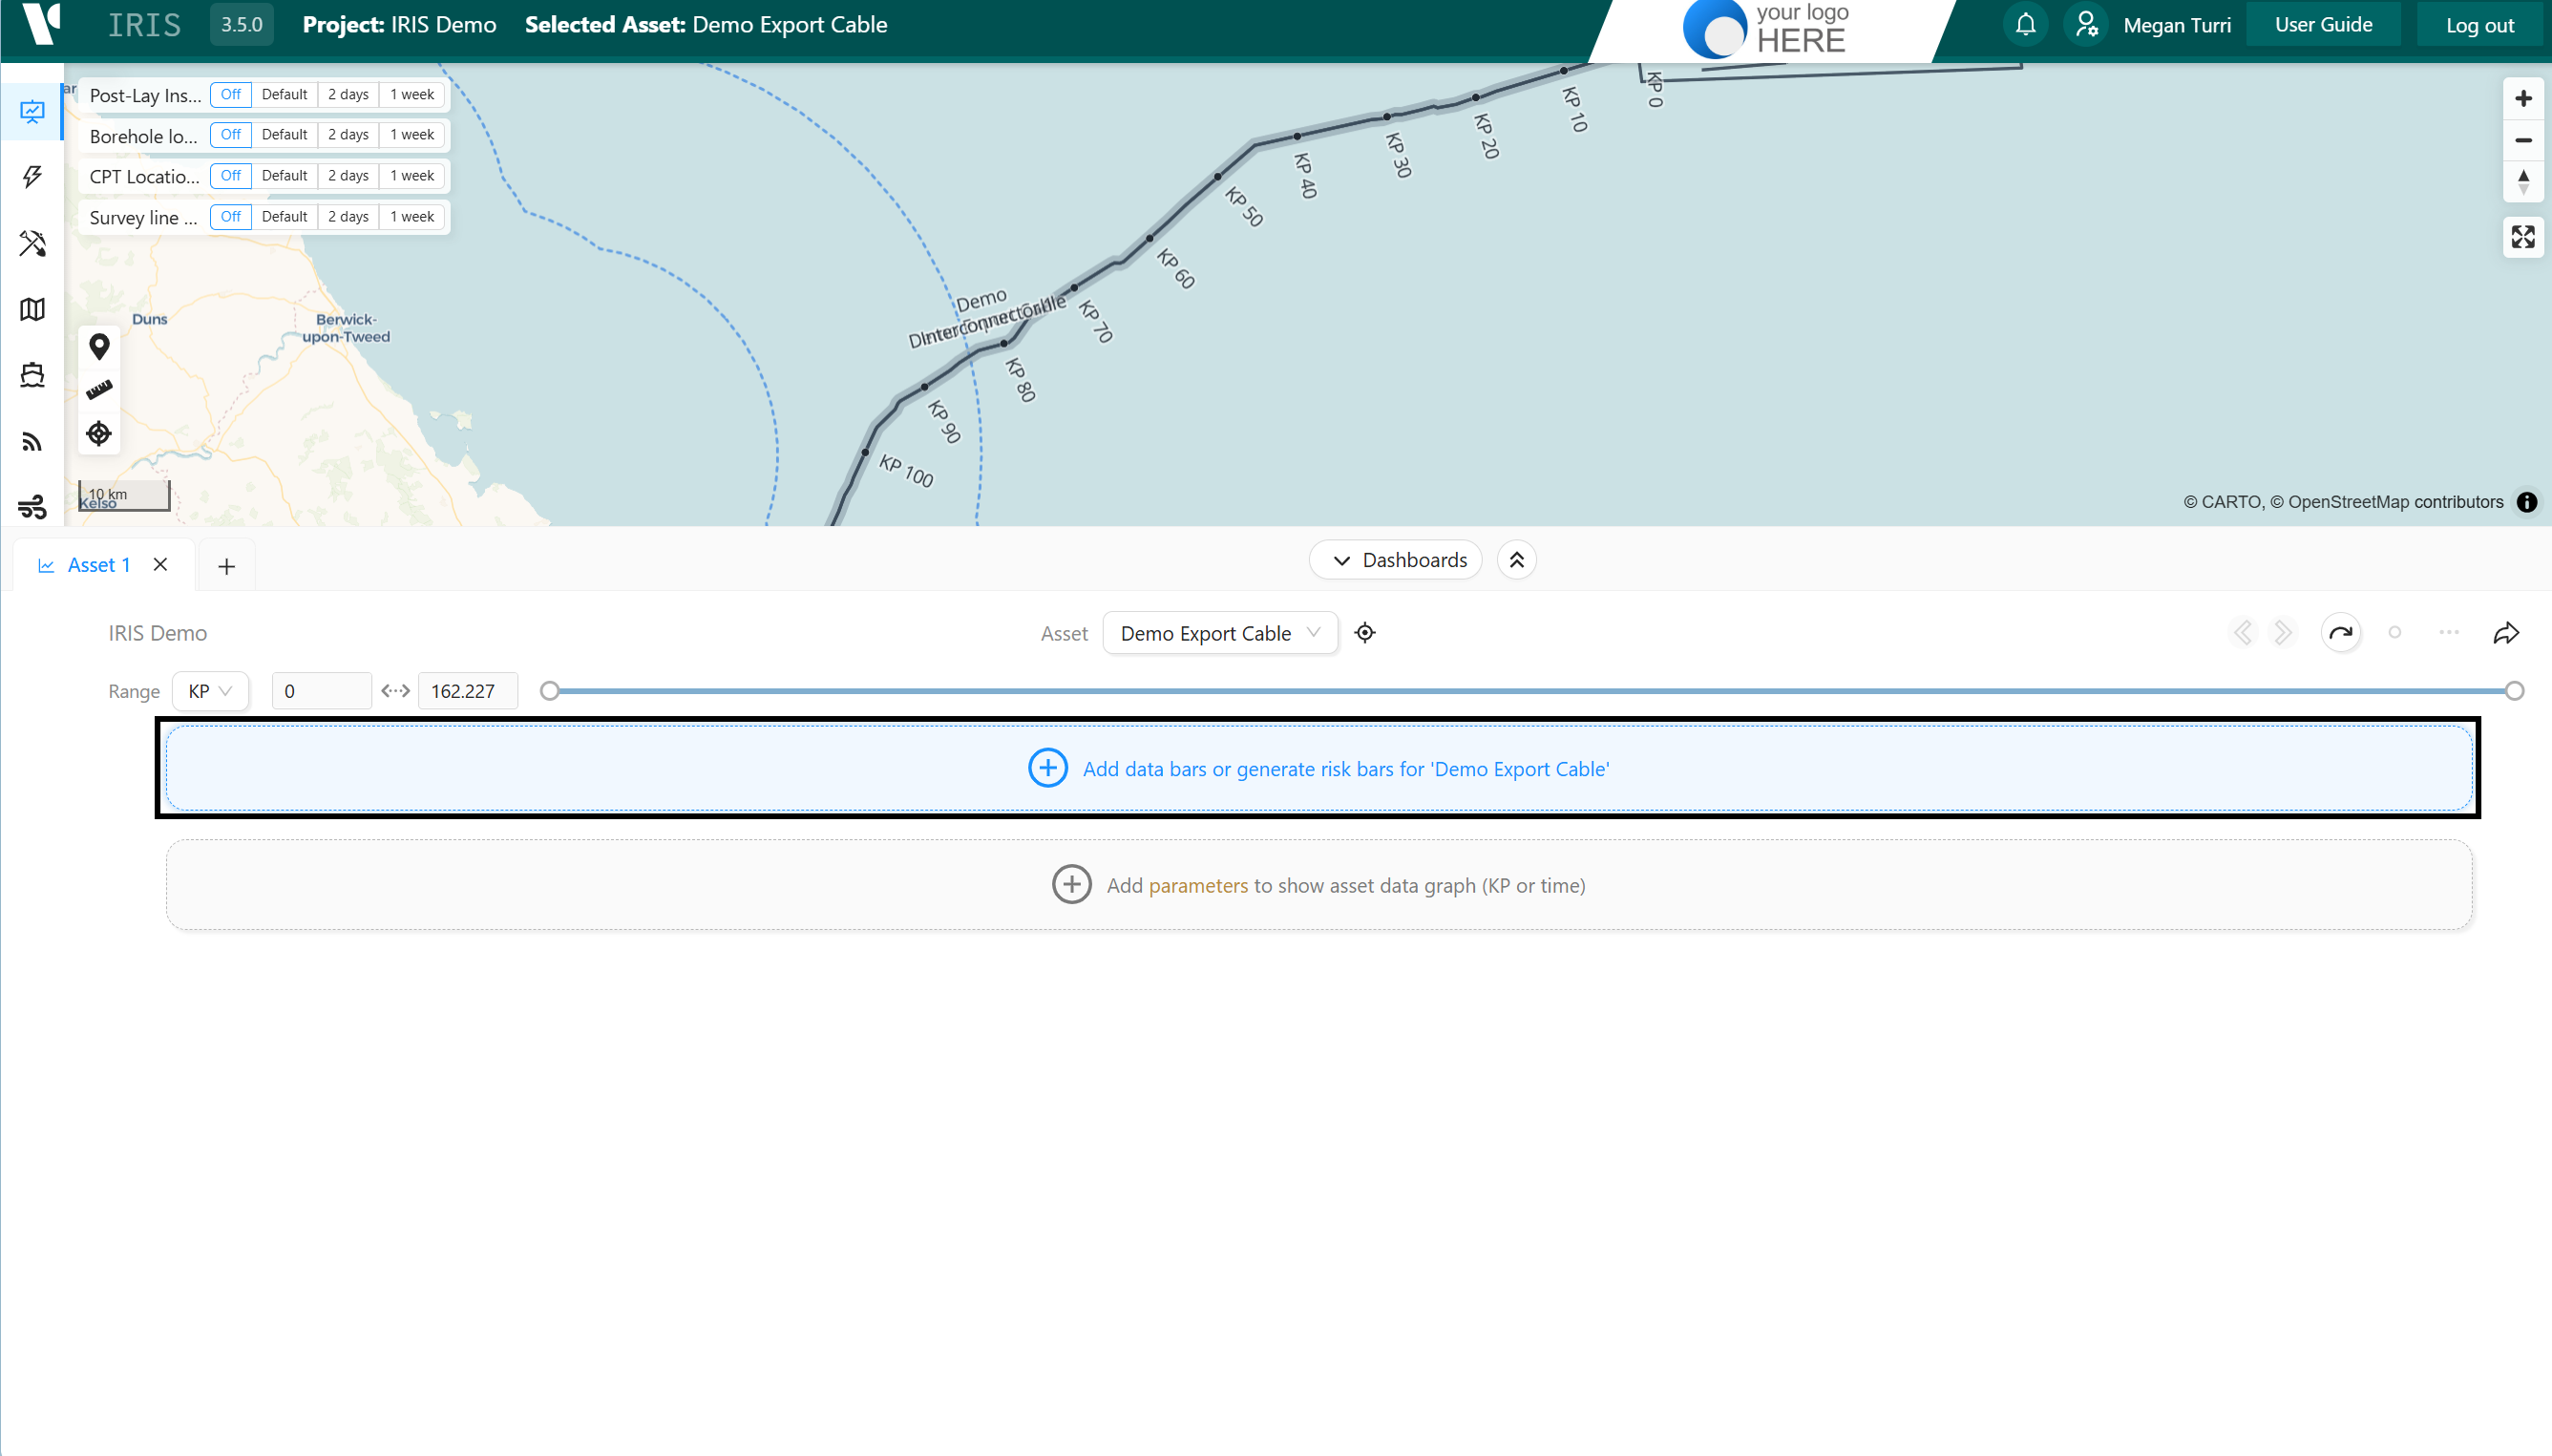
Select the Add Databars for Asset and select the Risk bar tab. This will show the previously generated risk bars for the selected asset within the project.
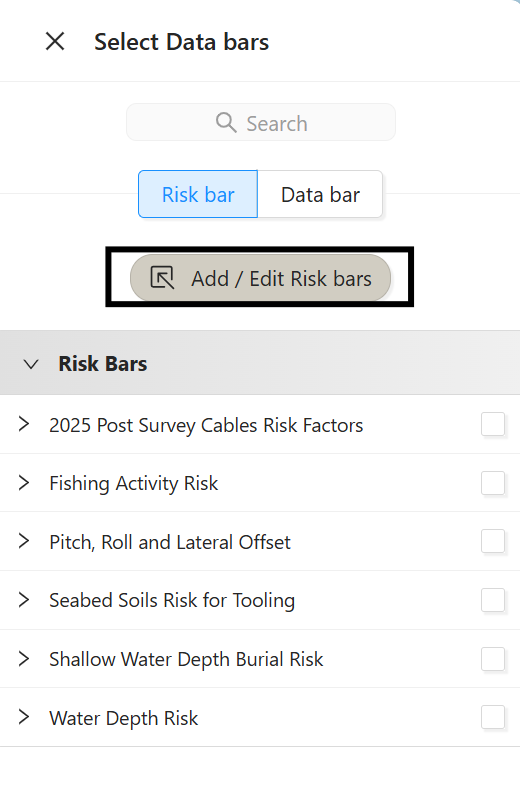
Select the Add/Edit Risk bars at the top of the list will bring up the risk manager table. This table shows a basic amount of information for each risk bar and allows users to edit, clone and delete an individual risk bar with the functions on the right.
The risk bar manager table shows all previously created risk bars for the currently selected Asset. You can also see risk bars generated by other users in your usergroup by checking the All user tickbox or similarly for all other Assets.
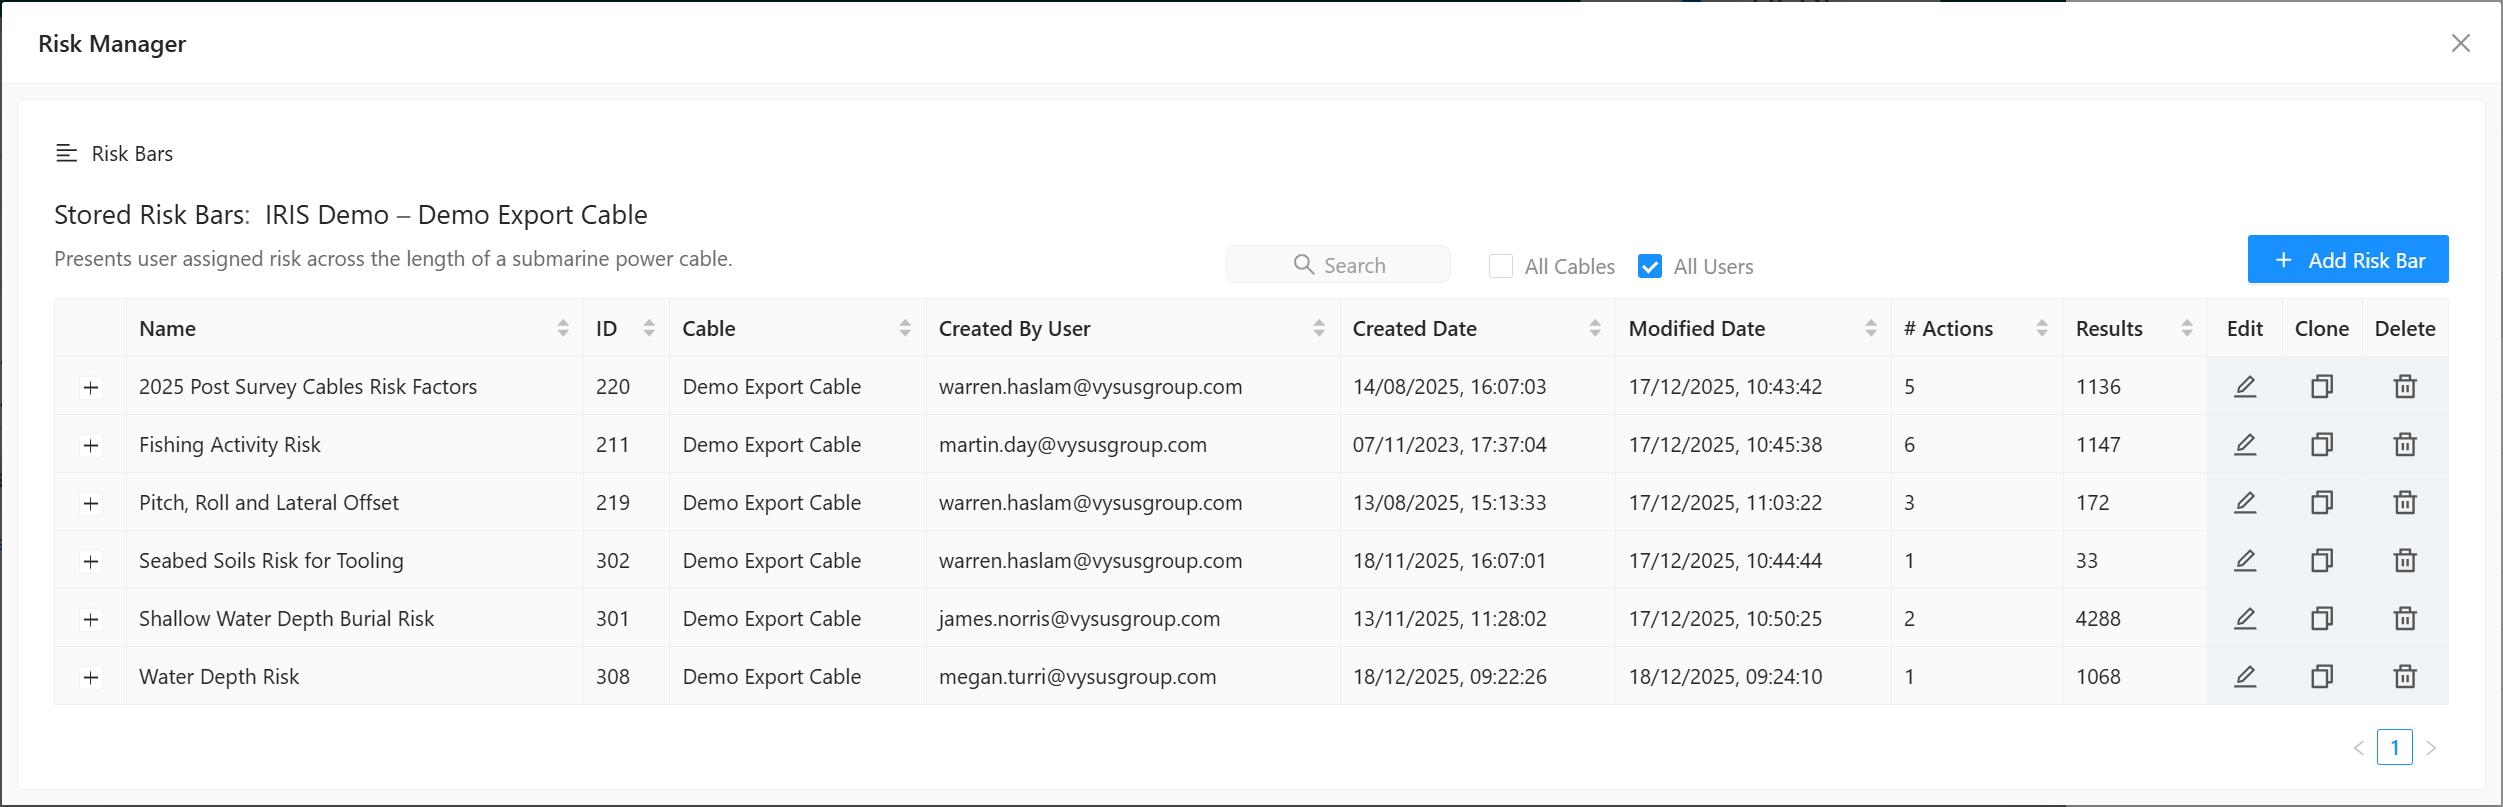
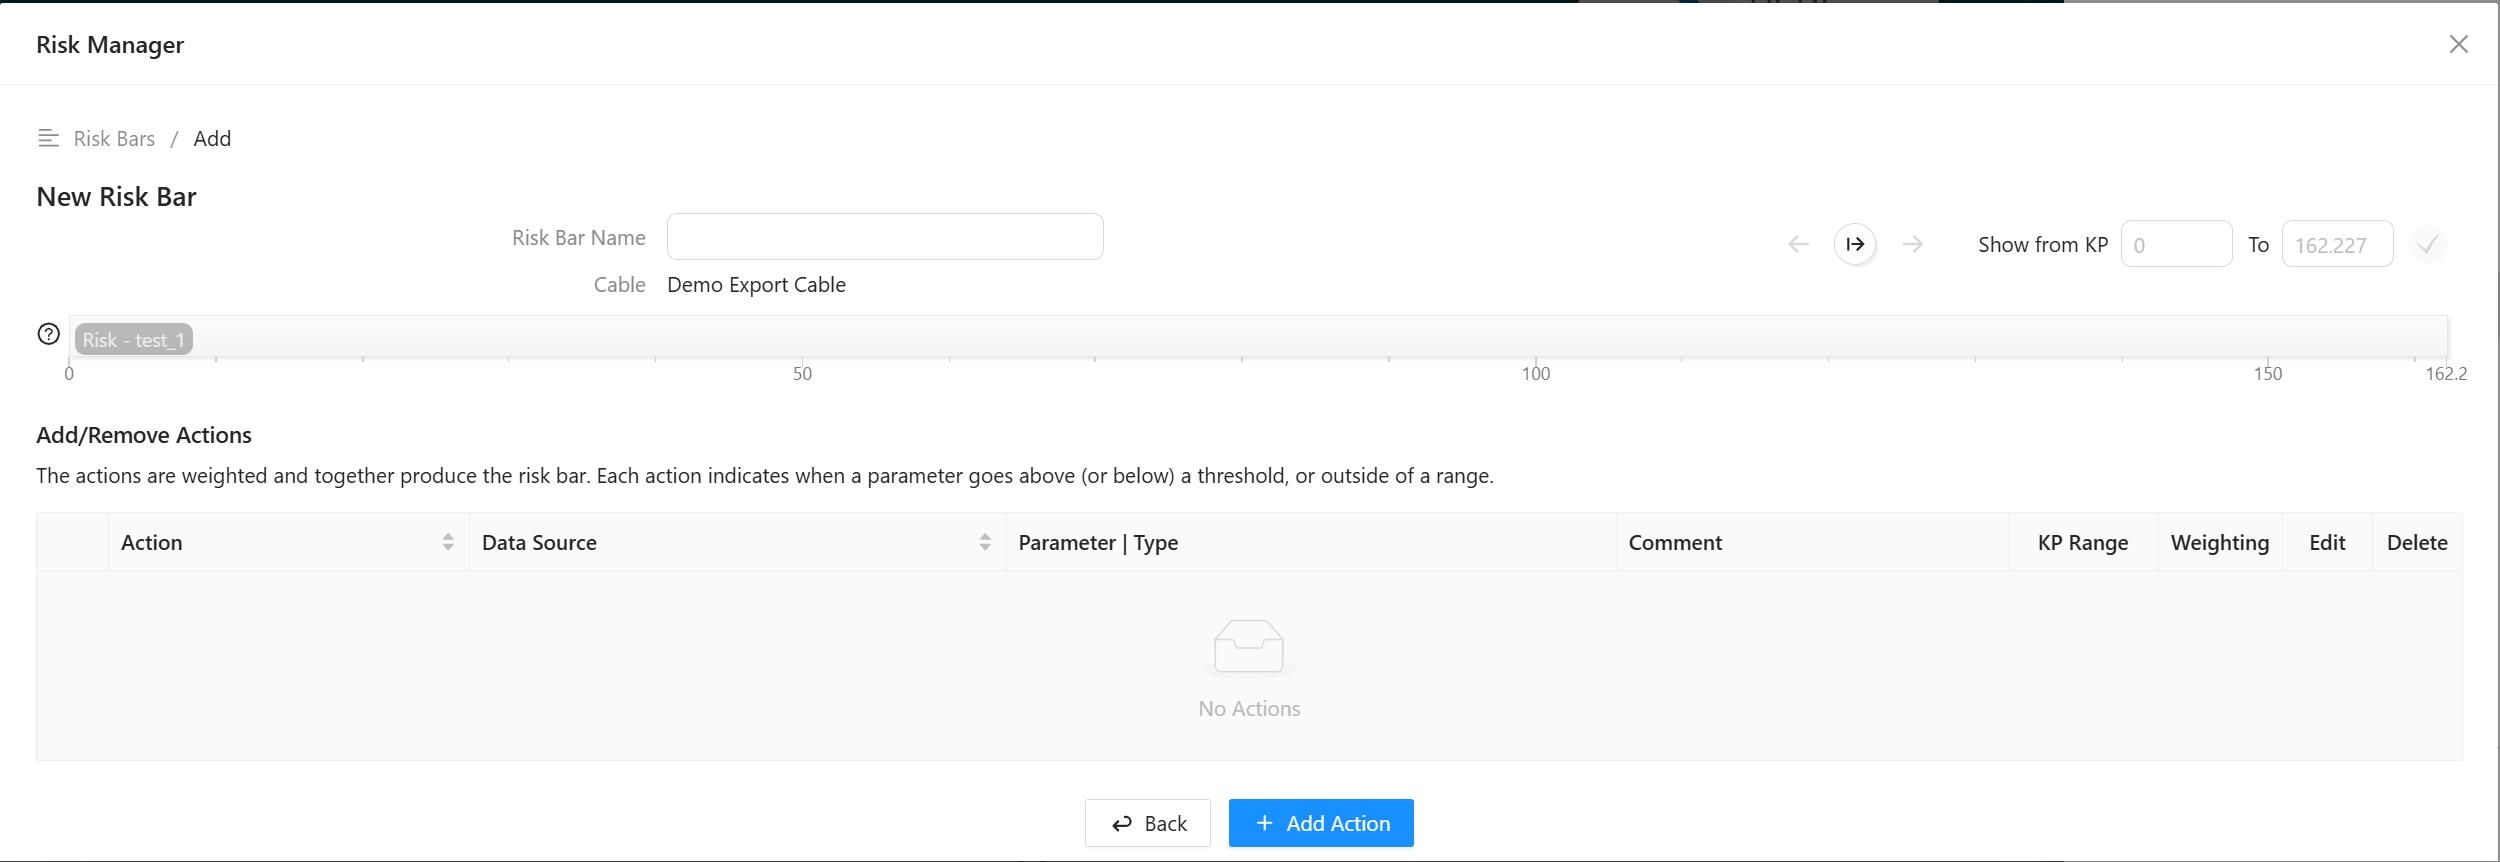
To generate a new risk bar, select the + Add risk bar button. This will open a new view which will allow you to change the selected asset if needed and name the risk bars.

Clicking save will show a blank risk bar.
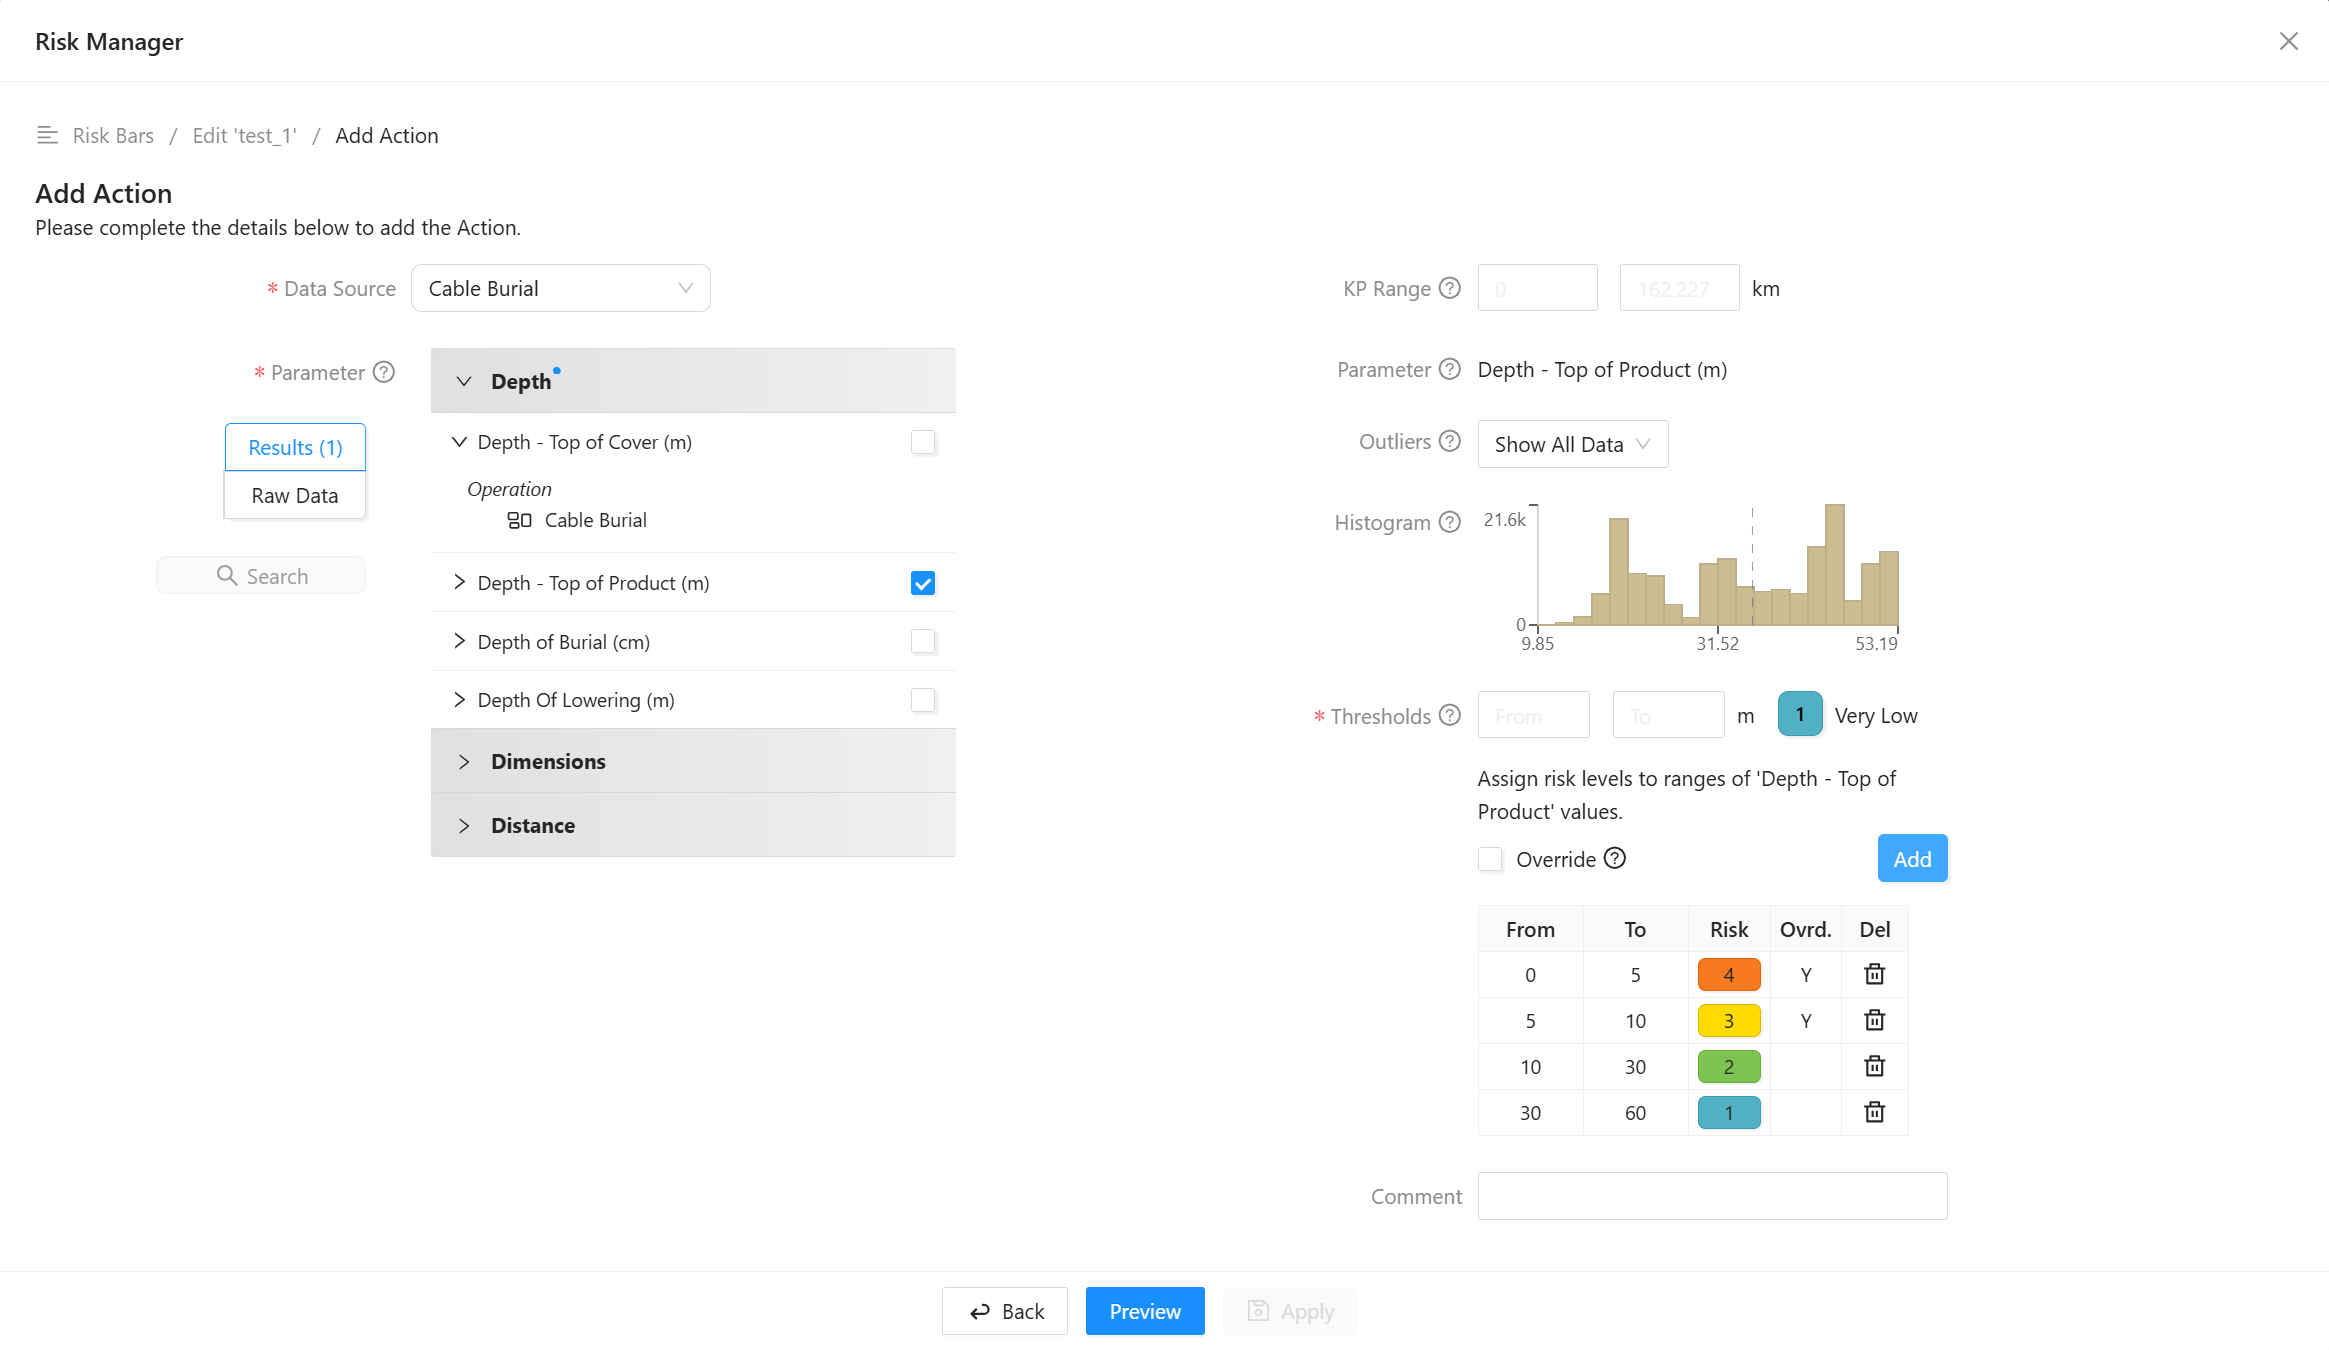
The next step is to Add Action and select the data from a variety of sources such as survey work, cable burial, defined data bars or an option for manual entry. Selecting the checkbox to the left of the data and alter the range or remove outliers if necessary. You can then assign risk values to defined thresholds within the selected data using the small table before applying.
Select the Override button first, if you want a particular data threshold to override any other risk levels added as actions e.g. if this particular threshold holds the highest importance and you don't want it averaged out by other factors.
Returning to the table, each action of teh risk bar is assigned a weighting which can be changed in the weighting column. Additional actions can be added in the same way.
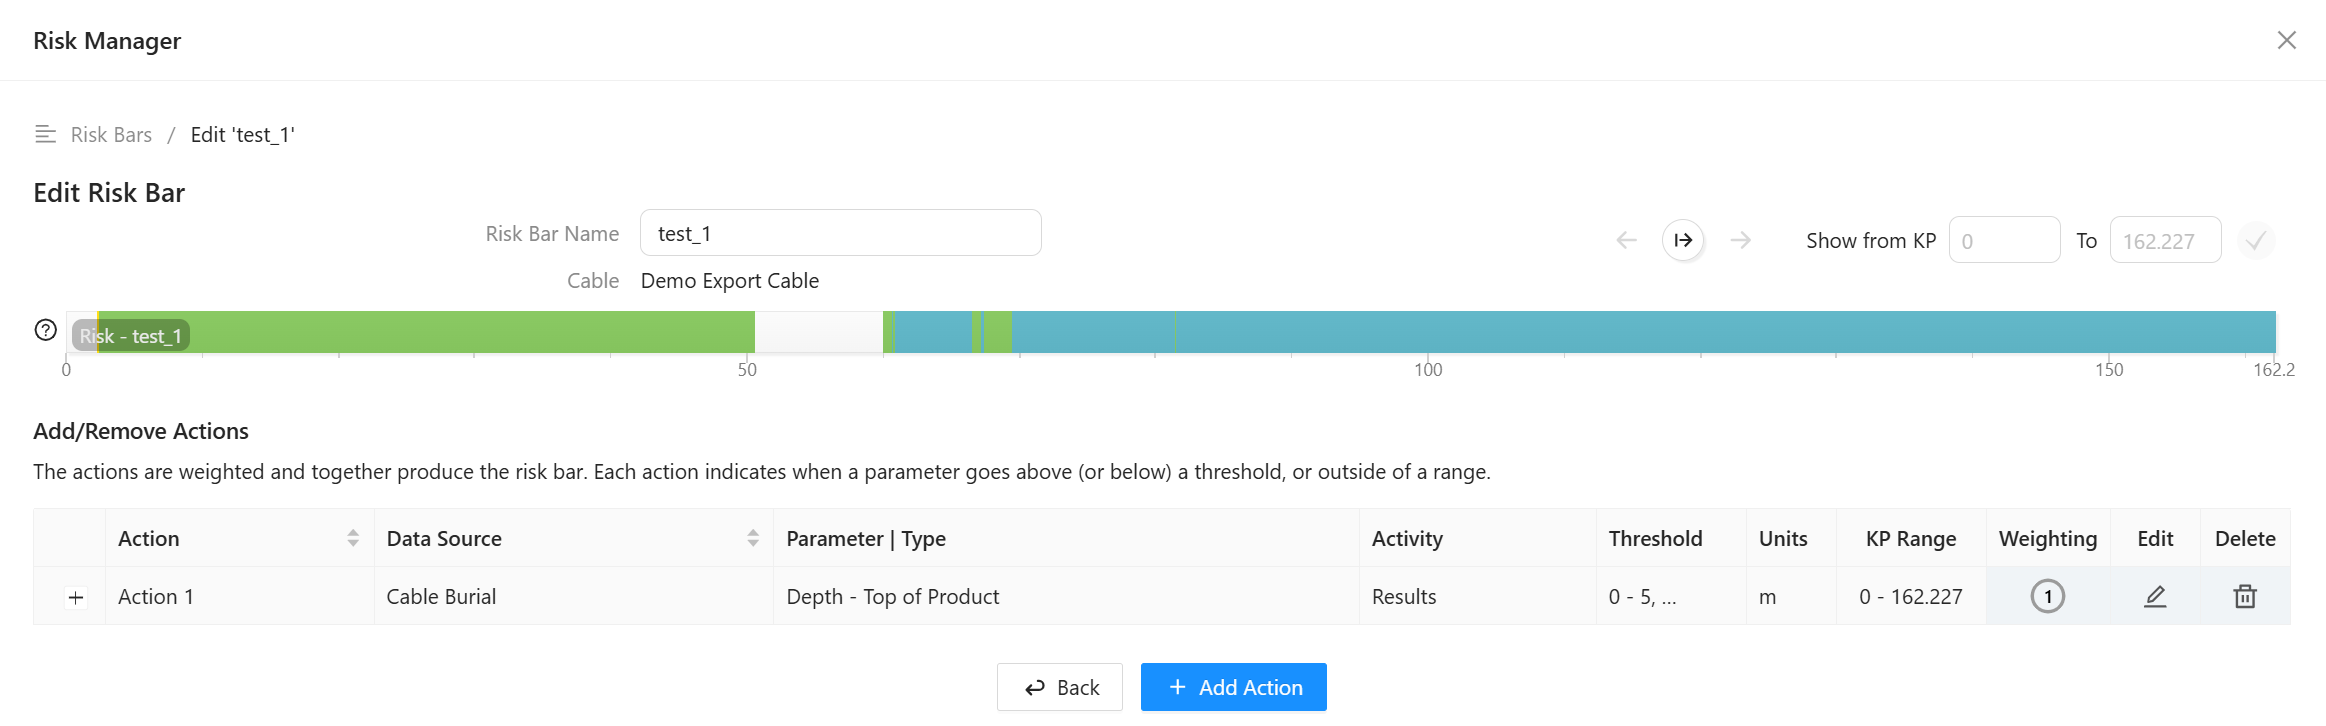
Adding a Risk Bar
The risk bar is created and saved within the previous table. It can be added to the asset dashboard in the same way as data bars. It will appear at the top of the parameter graph, aligning with the selected KP range.
The risk bar can also be added to the map view with the small checkbox to the left.