
Metocean Dashboard
Metocean Dashboard
The Metocean dashboard can be accessed by clicking Dashboard at the bottom centre of the screen and clicking the second tablet. This dashboard allows configuration and display of global forecast models, observation buoys, tidal gauges and project forecasts from a variety of sources including NOAA and EU Copernicus.
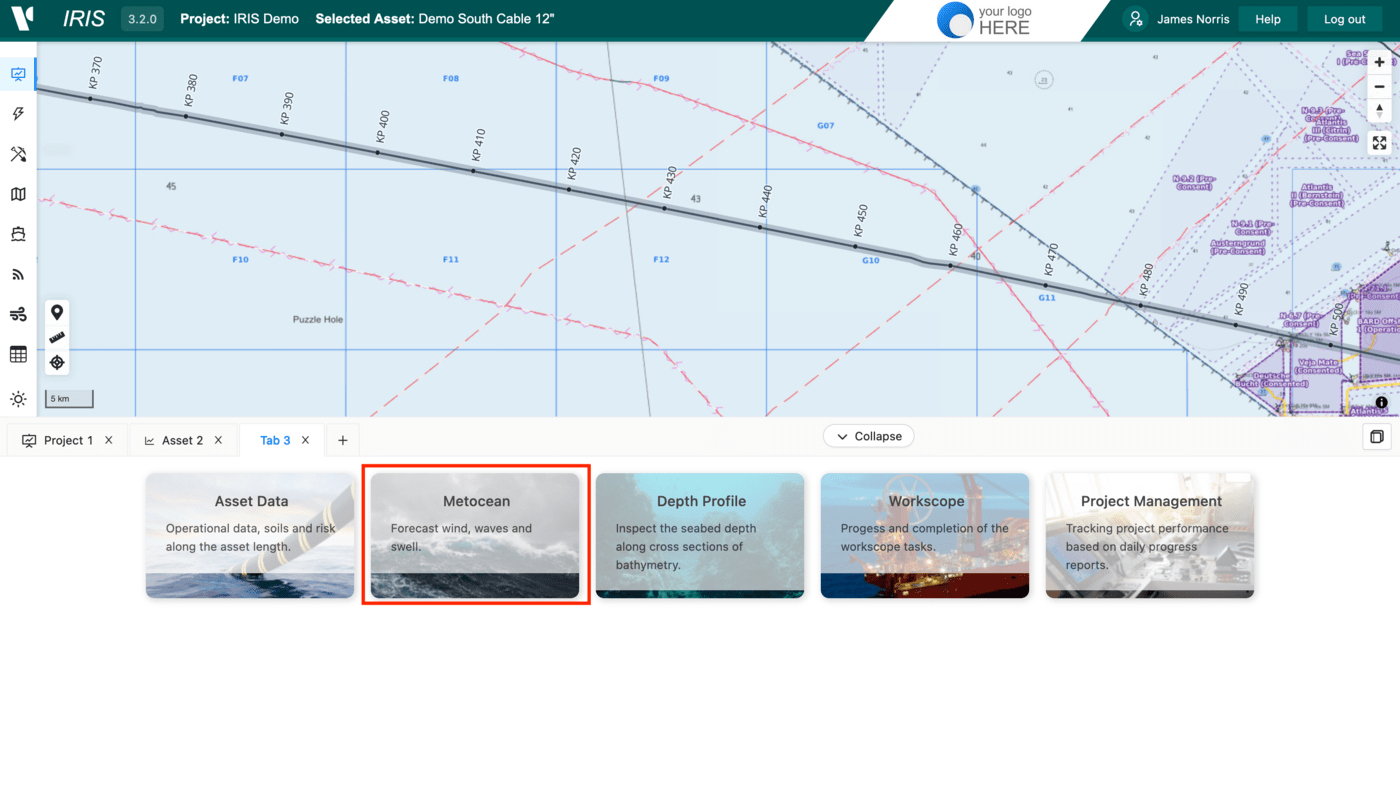
In the dashboard select the Location pin then and click a point of interest on the map. The forecast automatically displays and the dates can be adjusted using the date selectors on the right.
Specific project forecasts can be accessed to show the same data when in the dashboard. For this select the forecast location of interest, small green circles and the graph will set to this location.
Please note selecting anything over 2 months will take a significant amount of time. The data goes back to 2016.
The available data is grouped into three types which can be selected from the drop down list:
- Forecast Wind - Including wind speed and direction (
NCEP-GFS). - Forecast Wave - Including Maximum wave height, significant wave height, wave period and wave direction (
EU Copernicus). - Forecast Swell - Including significant swell height, swell period and swell direction (
EU Copernicus). - Forecast current - Including current speed and direction (
EU Copernicus).
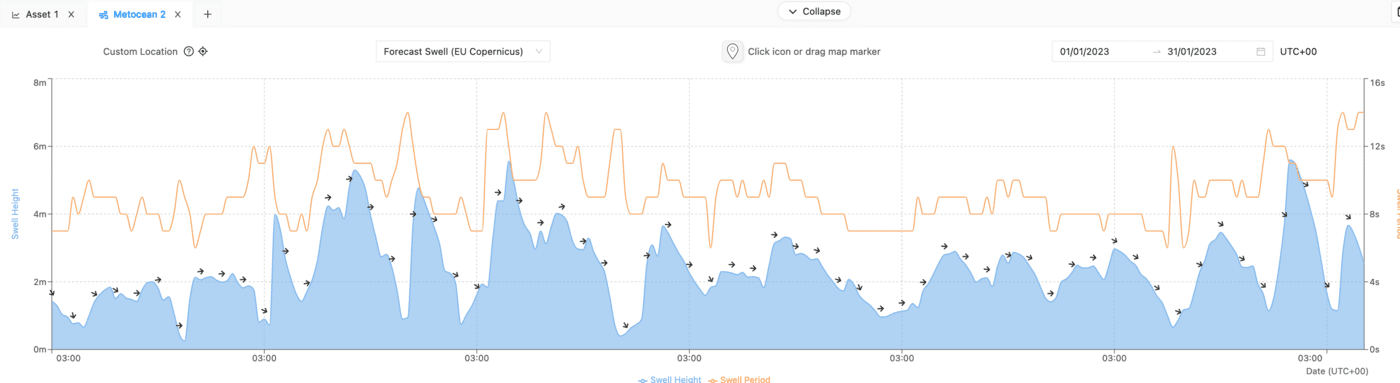
With each dataset a chart will be produced showing the variables selected for the selected date range, with the legend running along the bottom.
For selected variables (wind, current and wave), a data bar is present showing the portions of time working within a working vessel tolerance and a transit vessel tolerance. The tolerances will originally be set under the vessels tab however they can be edited through the settings cog at the beginning of the data bar.
If the time frame selected falls within an activity, an additional data bar can be added to show the dpr activities. For this select the DPR activities tab and select the appropriate activity and vessel then press okay. This will only show when the time frame is the same as the activity so you may need to check this.
These figures cannot be edited but can be exported using the export function as wither a chart or the raw data and will be viewable and interactive within the OCR report.