
Depth Profile Dashboard
Depth Profile Dashboard
The depth profile dashboard allows bathymetry profiles to be created along a created line or as cross sections stepped along a pipeline or cable Asset. Two overlaid bathymetry datasets can be compared to see sediment movement between surveys. 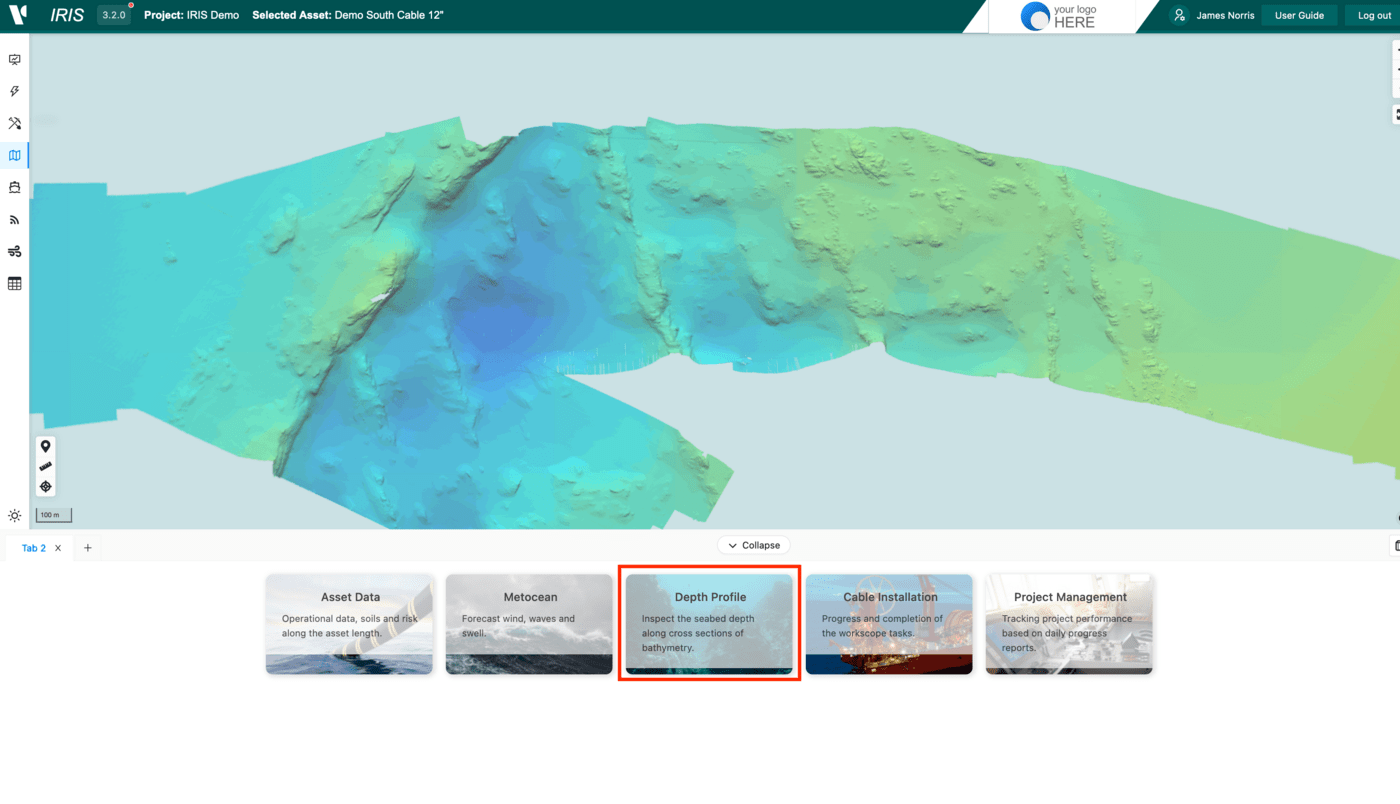
Custom Profile
To create a profile along a custom generated line:
- select the
customtab. - Choose bathymetry data layer(s).
- Click the pencil and draw a line using two clicks on the map window

The profile is displayed and difference is shown if two layers are selected and exist on that section of the map. The settings cog on the top right of the dashboard allows you to offset the first dataset if there is a noticeable difference in survey calibrations.
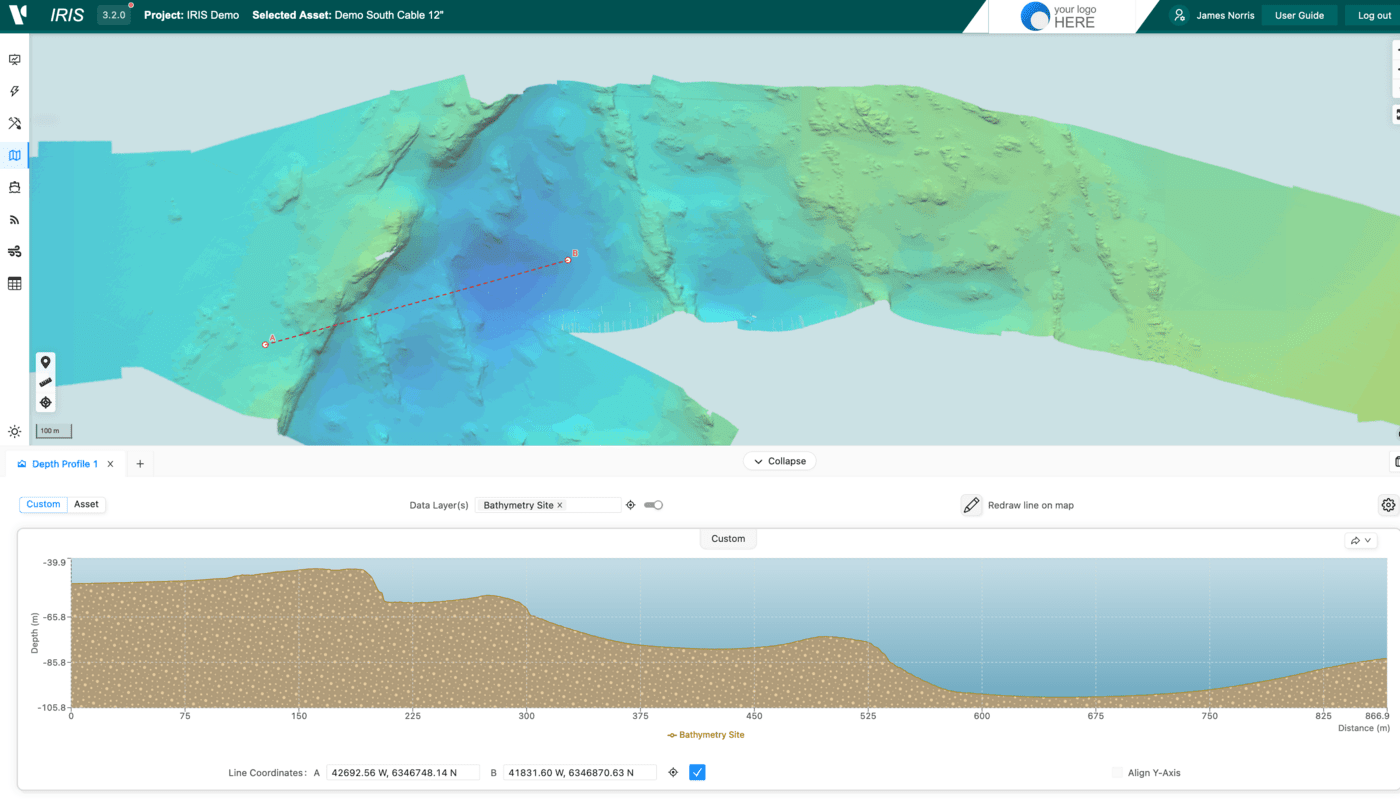
The line co-ordinates can be adjusted by setting co-ordinates at the bottom of the graph or by clicking the pencil again.
Asset Cross Profiles
To create a cross-profile along a pipeline or cable asset:
- select the
Assettab and subsequently the asset from the list drop down. - Choose bathymetry data layer(s).
- Select the KP value along the route.
- Change the settings using the
cog wheel:- Interval DAC (m) - The step interval along the KP route to do cross profiles
- Profle DCC (+-m) - The width of the cross profile.
- Vertical offset (m) - The value to align the two bathymetry datasets
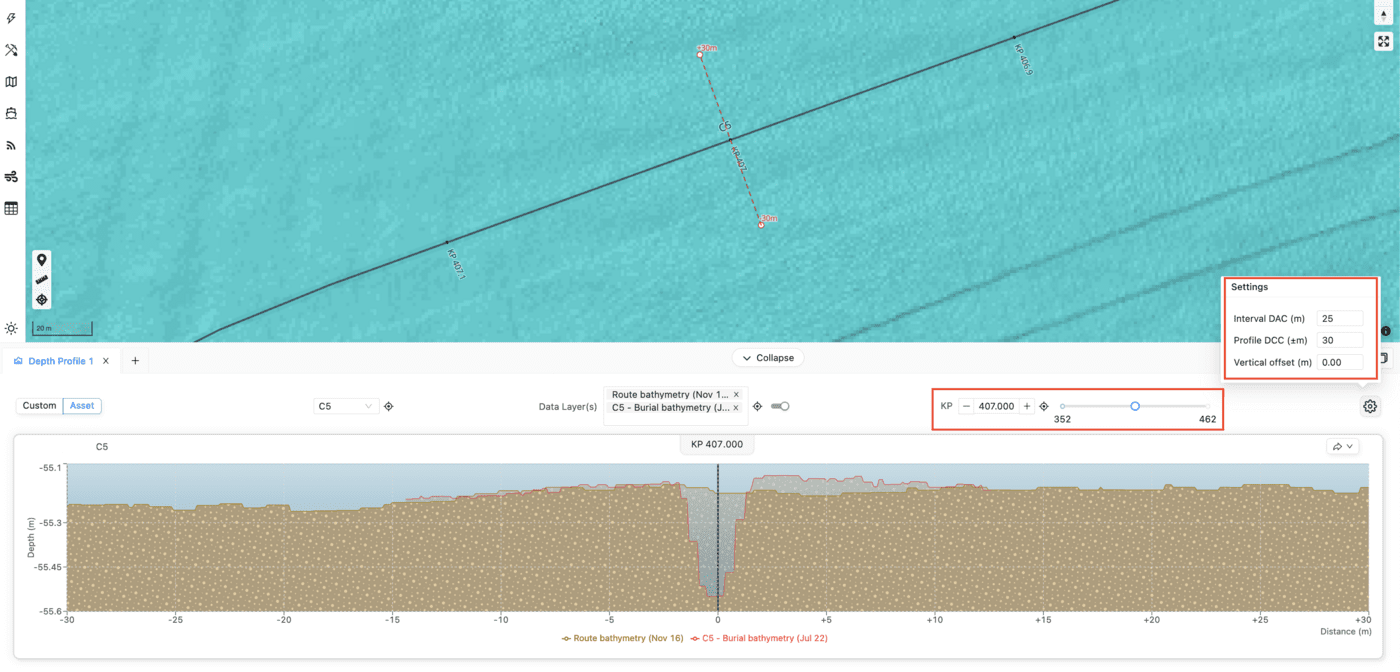
To move forward and back along the KP route at the set interval, click the + and - buttons either side of the KP value. The zoom to icons can be used to zoom to either the whole dataset or the current KP. 
As with other dashboards to export the data or the chart as an image select the Export button on the top right of the graph. 