
IRIS Dashboards
Dashboards
The bar along the bottom of the screen can be expanded to show dashboards. This is generally where you can see results, graphing and analysis of data and export to reports. When you relaunch an IRIS project the previously opened tabs will remain until mnaually closed. To rename a tab double click the tab name, to quickly close a tab mouse wheel click the tab name.
If a tablet is greyed out it's either not applicable to the current project or your usergroup doesn't have the required permissions to access it. Contact the IRIS team with any queries.
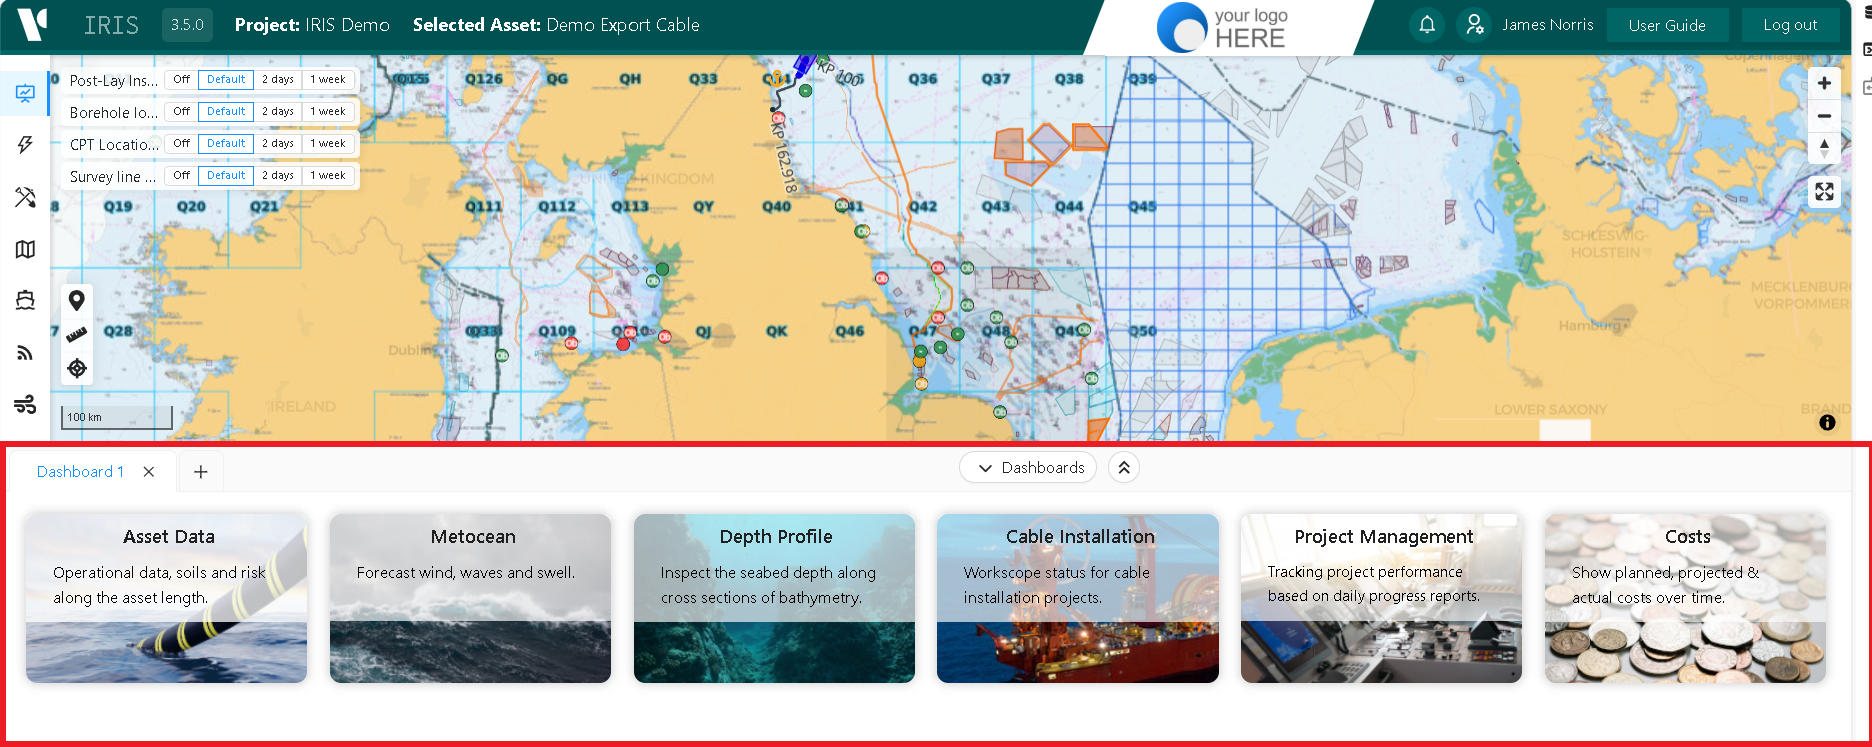
Select from the below to list to find out more about each dashboard.
Asset Data Dashboard- Graphing and databar of time or KP based data along an assetMetocean Dashboard- Graphing of forecast and hindcast weather dataDepth Profile Dashboard- Create depth profiles along a line or assetCable Installation Dashboard- Tracking project activities within cable installation projectsProject Management Dashboard- Graphing and reporting of project activity, HSE and work scope progressCosts Dashboard- Graphing and reporting of planned, actual and forecasted project budget and running costs