
Client Resprentative Guidance on using IRIS
Client Rep Walkthrough
What is IRIS
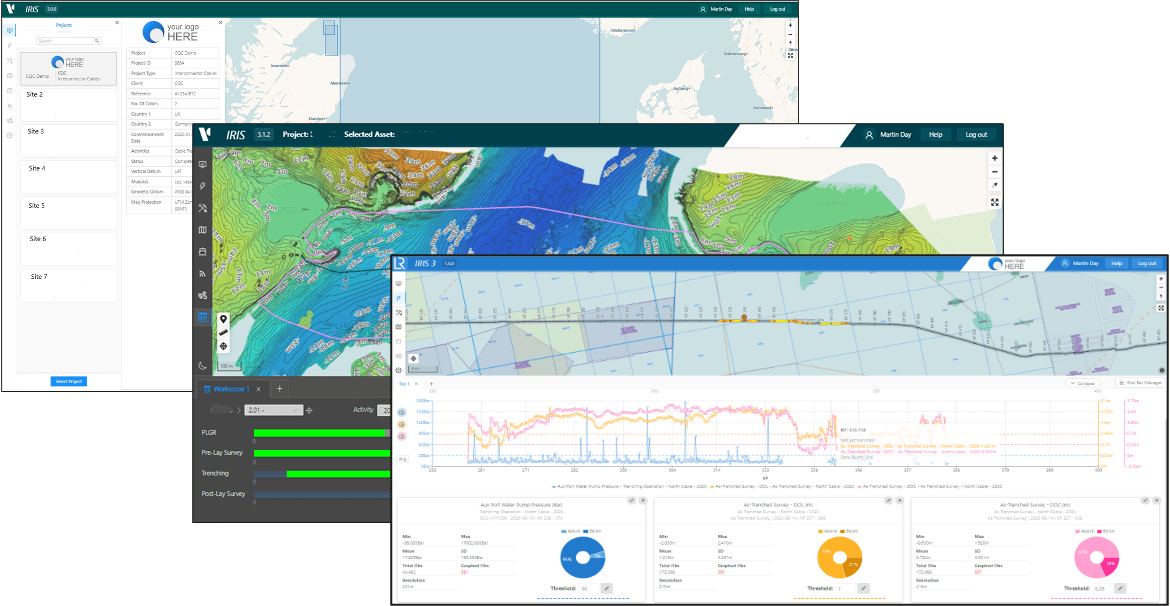
Designed for the offshore energy and cable sectors, IRIS 3 is the newly released version of our successful IRIS mapping and project management web application used widely in the offshore industry over the past 8 years. IRIS 3 is focused upon offshore survey, construction and subsea inspection projects and associated data and uses the latest web mapping frameworks and secure cloud delivery platforms.
IRIS 3 allows clients to bring all projects, project phases and project data into a single portal for visualisation, assessment and analysis. The IRIS 3 CableQC module allows for the management of cable data and the determination and visualisation of assessed risk along the length of the cable.
For more info see the page What is IRIS.
IRIS Project Performance Objectives
A fundamental objective for Vysus Group is to capture offshore project performance data as the project progresses, in a way that puts structured data and information directly into a database server.
By doing this, through the prism of a web map platform we can:
- Achieve the closest 24/7 visibility to project progress, status and forecast for our Project Managers our Clients and their Stakeholders, supporting efficient decision making associated with the work scopes, schedules and budgets
- Deploy tools and analysis to identify issues, trends and performance indicators for individual contractors, vessels and equipment across single and multiple projects.
- Auto generate weekly or monthly project progress and outlook reports
- Auto-generate consistent OCR reports
- Maximize the significant value of 'Observations' in a way that can be readily recalled, analysed and grouped across multiple projects
Getting Started
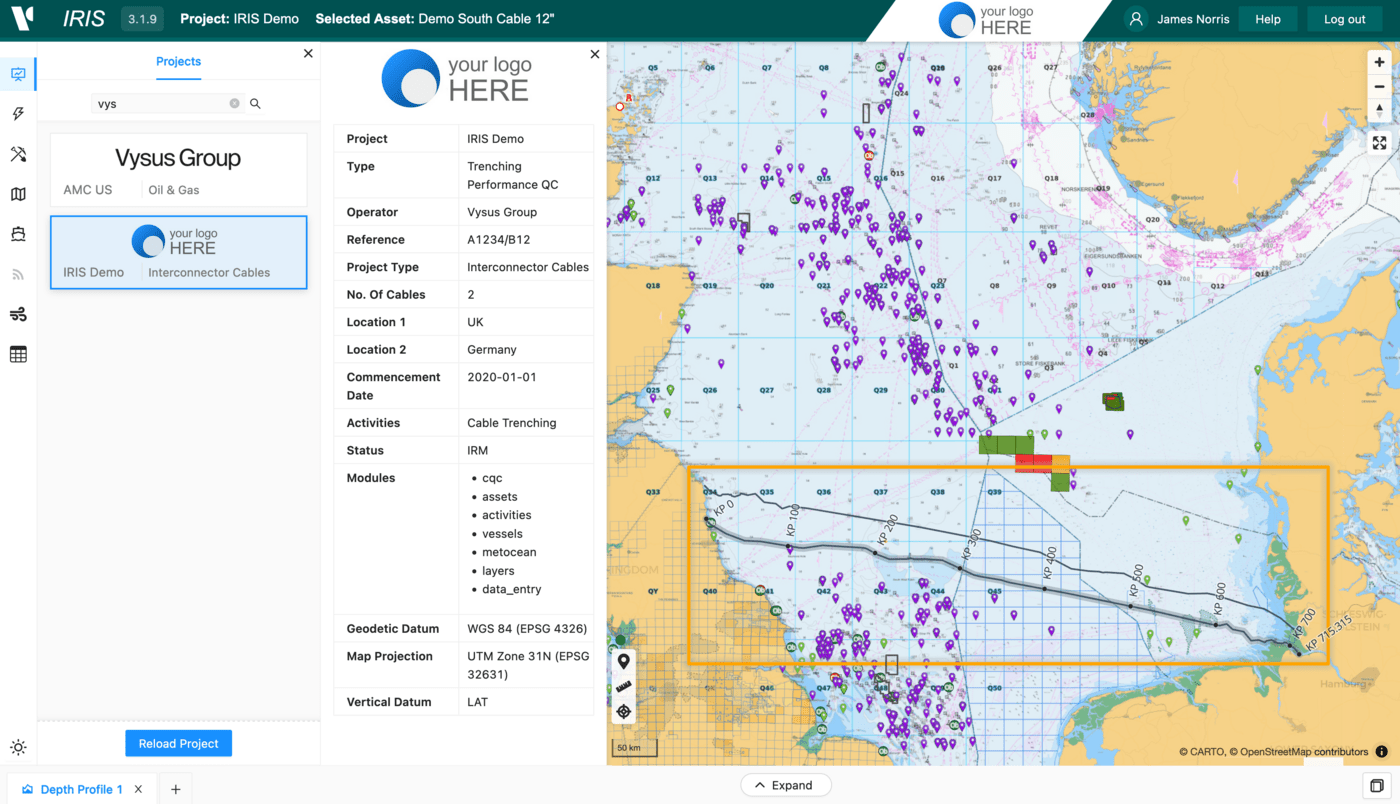
Access the IRIS site at the following web address https://iris.vysusgroup.com and log in to the IRIS site using your pre-issued username and password. Once logged in there is a comprehensive user guide accessible from the right hand side of the top bar:

Your permissions profile will be restricted to your client's current project to which you are deployed.
Use the Project Selector icon to select the project from within the Operational tab. Click Load Project to display the project.
Accessing Features and Functionality of IRIS
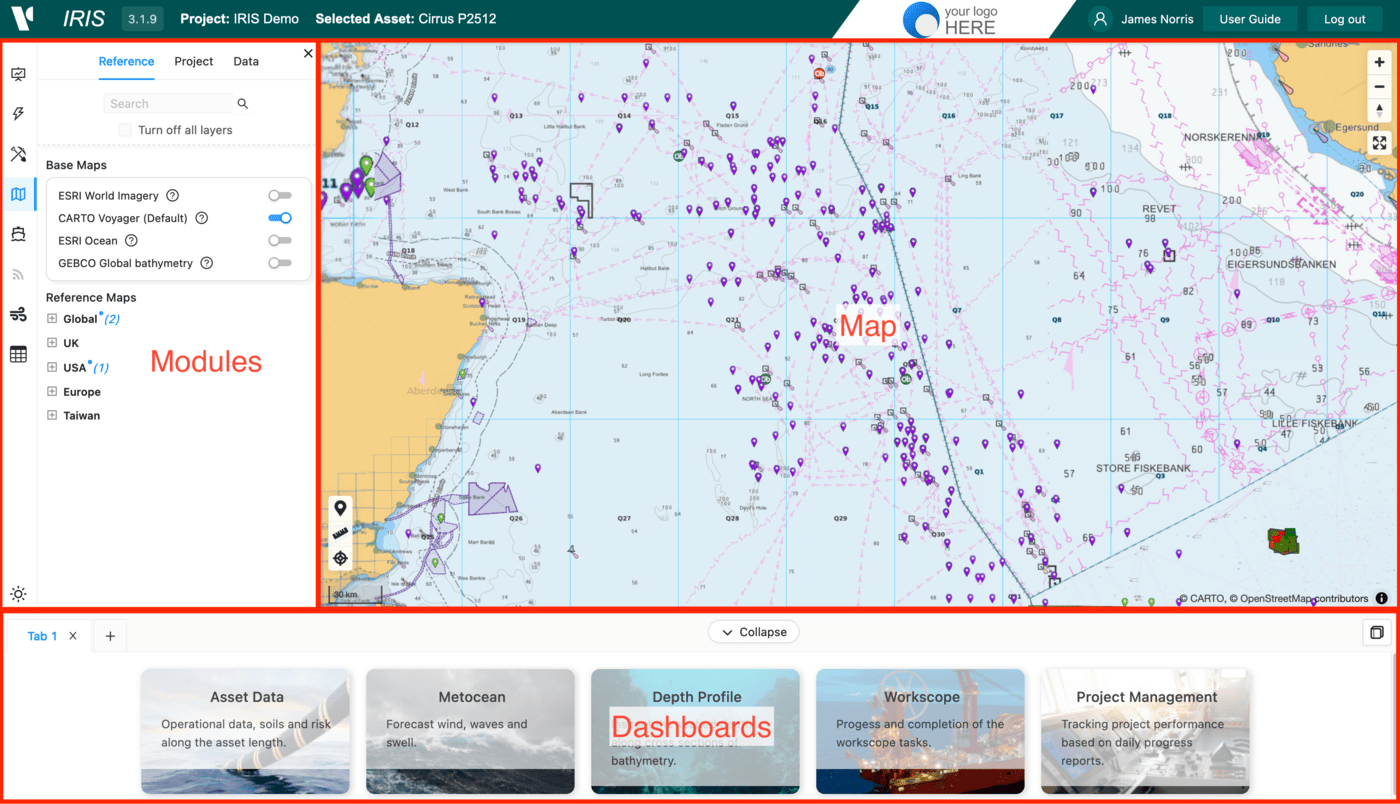
The IRIS 3 application is structured around modules, accessed via the icons within the vertical bar on the left side of the portal and dashboards along the bottom.
The philosophy, features and functionality of IRIS 3 are fully described within the rest of the Userguide and modules through the links below:
Projects Module- Select project from those availableAssets Module- Select relevant infrastructure assets within the projectActivities Module- Sequential organisation of all offshore project activitiesData Module- Select data layers for display on the mapVessels Module- Real-time and replay of vessel positionsTelemetry Module- Digital data streaming from offshore vesselsMetocean Module- Maps and plots of forecast and hindcast global metocean dataData Entry Module- Offshore project performance and status data entryCost and Scheduling Module- Project budget and cost tracking data entryPoints of Interest Module- User editable location or line based map layers
Dashboard information can be accessed through the following links:
Asset Data Dashboard- Graphing and databar of time or KP based data along an assetMetocean Dashboard- Graphing of forecast and hindcast weather dataDepth Profile Dashboard- Create depth profiles along a line or assetCable Installation Dashboard- Tracking project activities within cable installation projectsProject Management Dashboard- Graphing and reporting of project activity, HSE and work scope progressCosts Dashboard- Graphing and reporting of planned, actual and forecasted project budget and running costs
The remainder of this walkthrough describes the data entry requirements of the OCR primarily through the Data Entry Module.
Project Management Module - Data Entry
There are 4 Data Entry areas for completion by the OCR:
- DPR Data
- HSE Incidents & Observations
- Work Scope Status
- OCR Report Questionnaire
For detailed information and user guidance on entering data, please refer to the Data Entry Module.
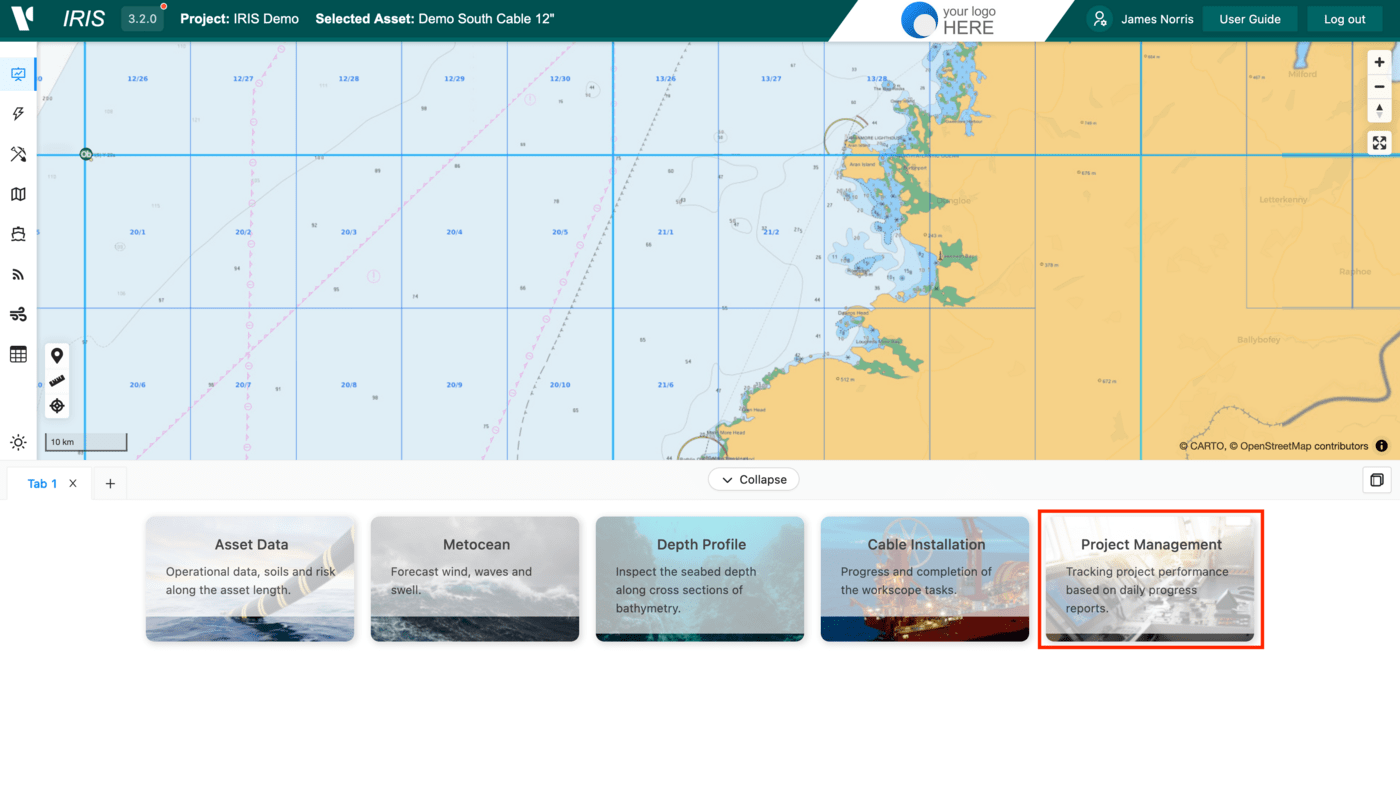
Note that only OCRs and the Project Manager have assigned permissions to access the Data Entry module. This is not available to all other IRIS site users. However, all users are able to see the data entries and associated graphics within the Project Management Dashboard accessed at the bottom of the portal.
Data Entry - DPR Information
Typically this will be copied straight from the agreed and issued DPR and consists of Operations and HSE data. Ideally, this information should be enter as soon as possible after the DPR is issued onboard.
Select the Daily Progress tab, the Vessel Activity, the Vessel Name and the DPR Date. Expand the form and enter the DPR Data.
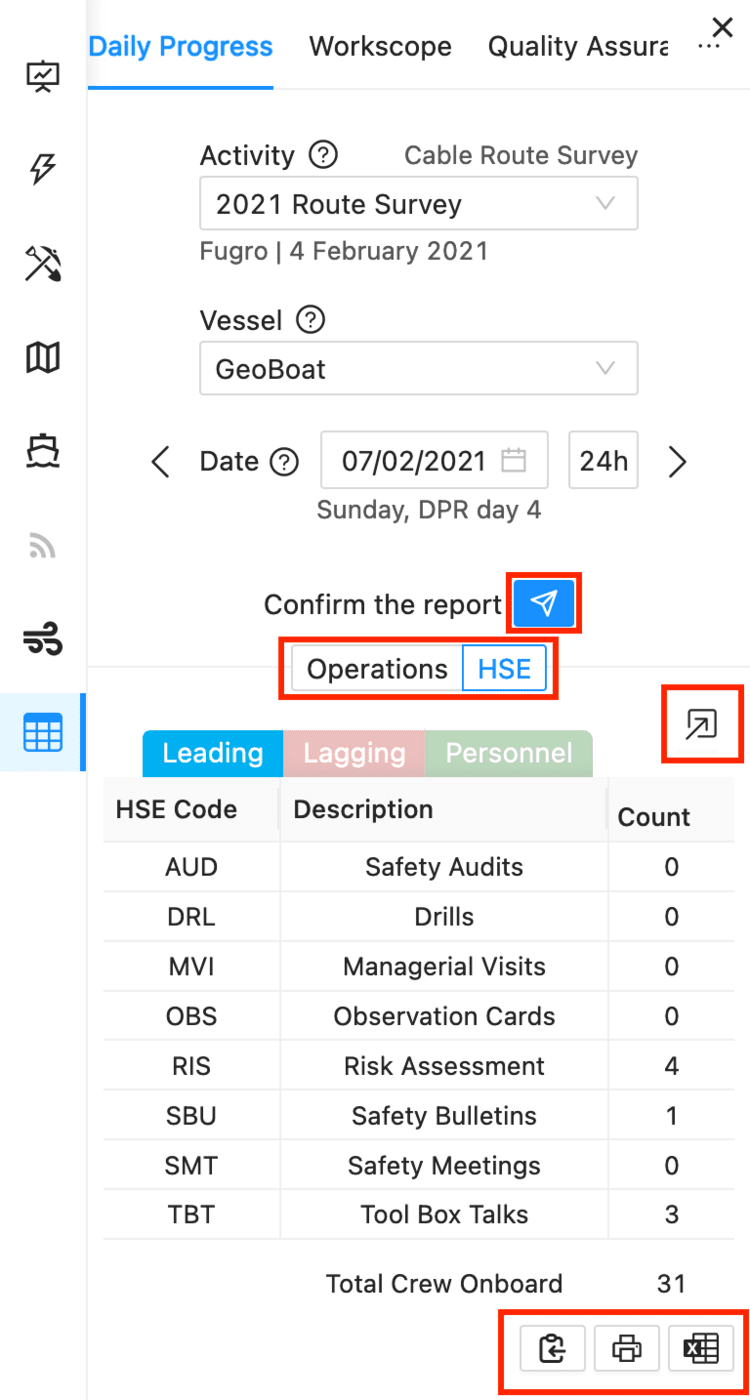
Note that data already in a CSV or TSV format can be imported, whereas data in a PDF or Excel DPR format will need to be entered manually. This can be done using the 'Import csv/tsv' button at the bottom of the form.
Operations
- The DPR Codes will be pre-populated for your selection
- Enter the time and the code in the usual manner and any relevant comments. If you have a single code split into several consecutive blocks in the DPR you can group them into a single entry.
HSE
- The HSE codes are based upon an
IMCAdocumented standard of lagging and leading indicators e being used by theContractor, please use best judgement to map onto the IRIS HSE codes. - Make sure you enter a value for
Total Crew Onboardfor the DPR day to be confirmed.
Once both of these sections have been completed click confirm to save the changes and confirm the daily progress, turning the date selector green. This will be greyed out if a section is incomplete such as the time not adding up to 24 hours.
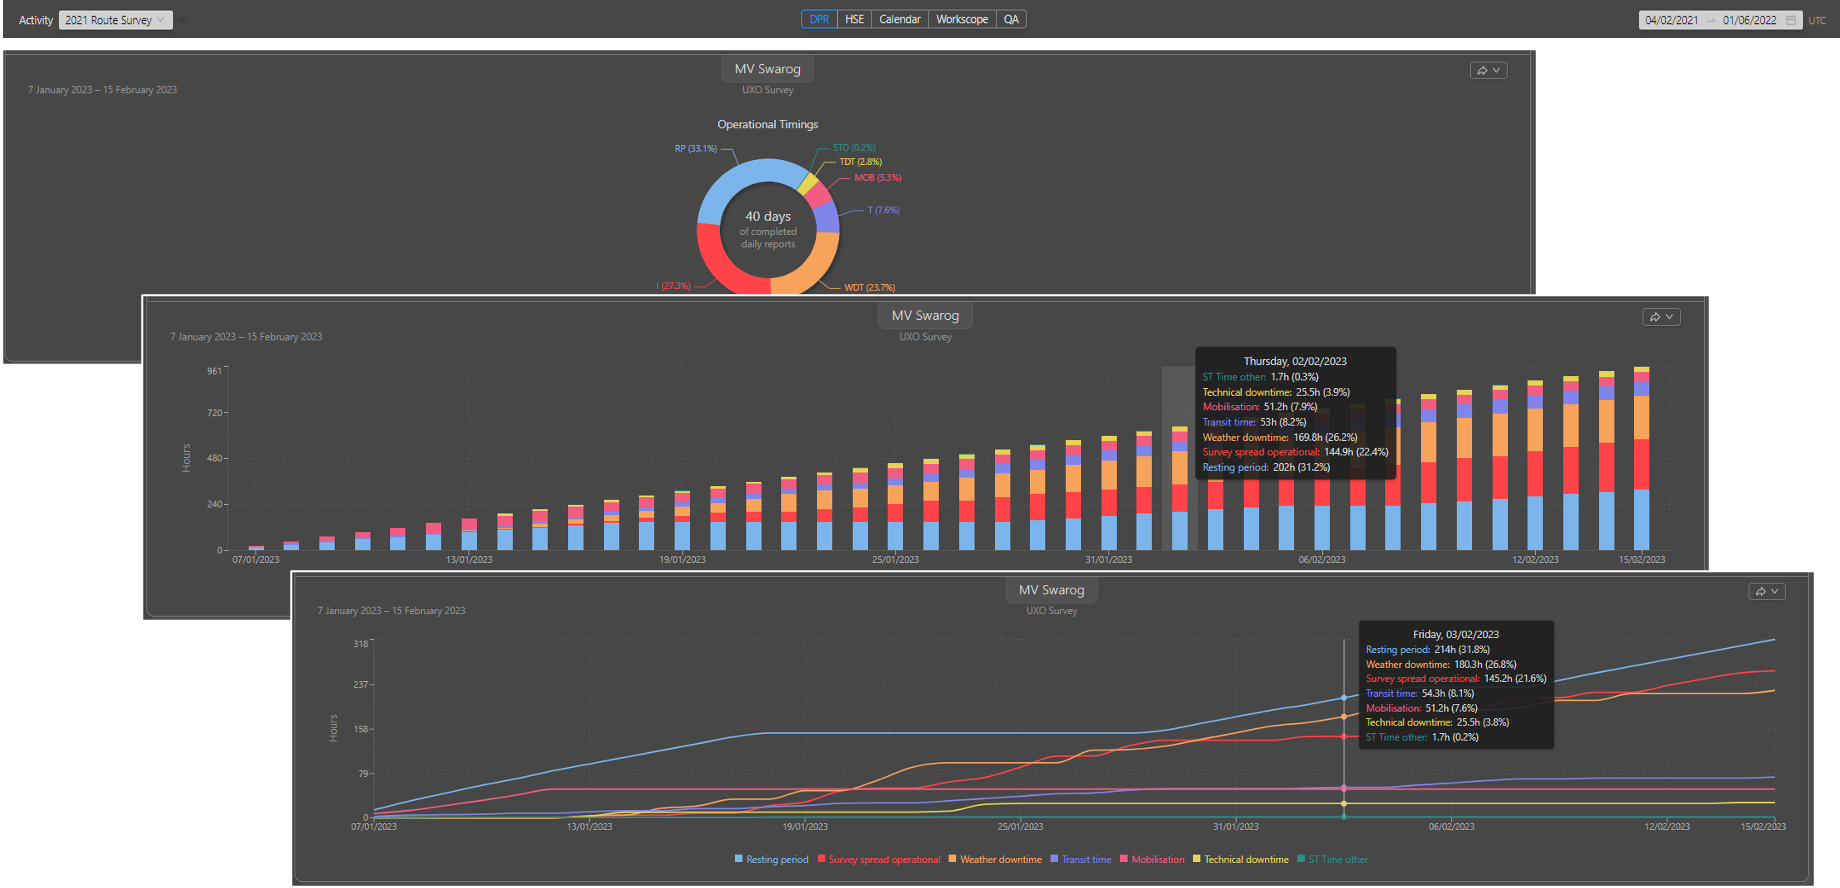
For more detailed information and user guidance on entering DPR data, please refer to the Data Entry Module page. The resulting data can be displayed and queried in the Project Management Dashboard as seen below:
Data Entry - Work scope
The work scope status is not specifically linked to the DPRs and needs to be updated separately. A work scope is categorised into 4 defined types: Lines, Locations, Zones and Routes. Surveys may consisting of elements from 1 or more of the 4 types, and the respective tabs will be available to be filled in.
Select the Work scope tab, select the relevant Activity and expand the relevant data entry form. The full work scope status is now displayed with full granularity down to the individual line, location or cable route.
Each work scope will require slightly different information, however a regular update for the following information is needed for all:
- Status - Update the
statusof the line from the options within the drop down list - Comments - Add appropriate comments with respect to the work scope type or tasks associated with the survey of it.
- Vessel completed - Add the name of the vessel that completed the line/location/zone or task from the drop down list
- Date - Enter the data the line/location/zone or task started, and then on any subsequent
statuschanges for zones or tasks - Data Quality - Select the equipment type from the drop down list and enter a rating (0-5) for the performance and quality of the equipment, with either positive or negative comments relating to rating. The
Useranddatecolumns are auto populated and then can be applied to the whole work scope usingApply Equipment.
Additional information is needed for a Route work scope as these will comprise of multiple Tasks. This can include: information on vehicles, the number of passes completed and the KP range which updated the progress display bar.
For more detailed information and user guidance on updating the workscope, please refer to the Data Entry Module page. The resulting data can be displayed and queried in the Project Management Dashboard as seen below:
Save Changes
Once you have completed your data entries, click the Submit button at the foot of the primary form. The data can be subsequently edited and updated in the same manner as described above.
Data Entry - Quality Assurance
The quality assurance tab is where you can submit your observations of the state of operations onboard the vessel. This includes Lessons learnt, A standard questionnaire and a rep register.
Quality Assurance - Incidents
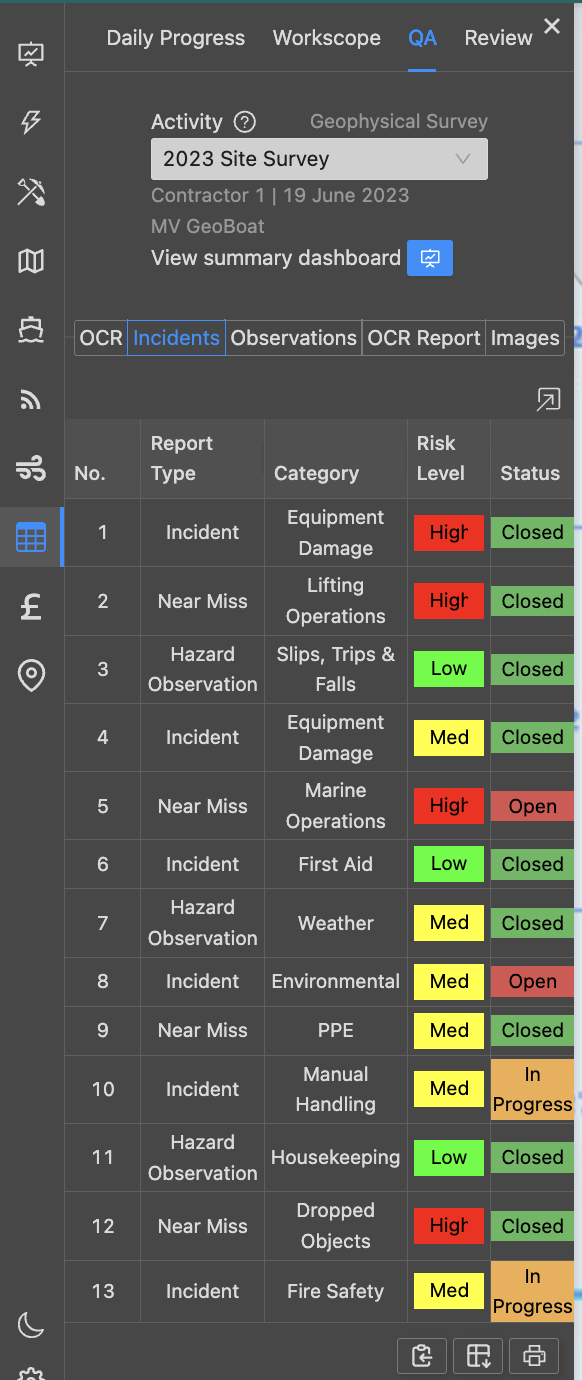
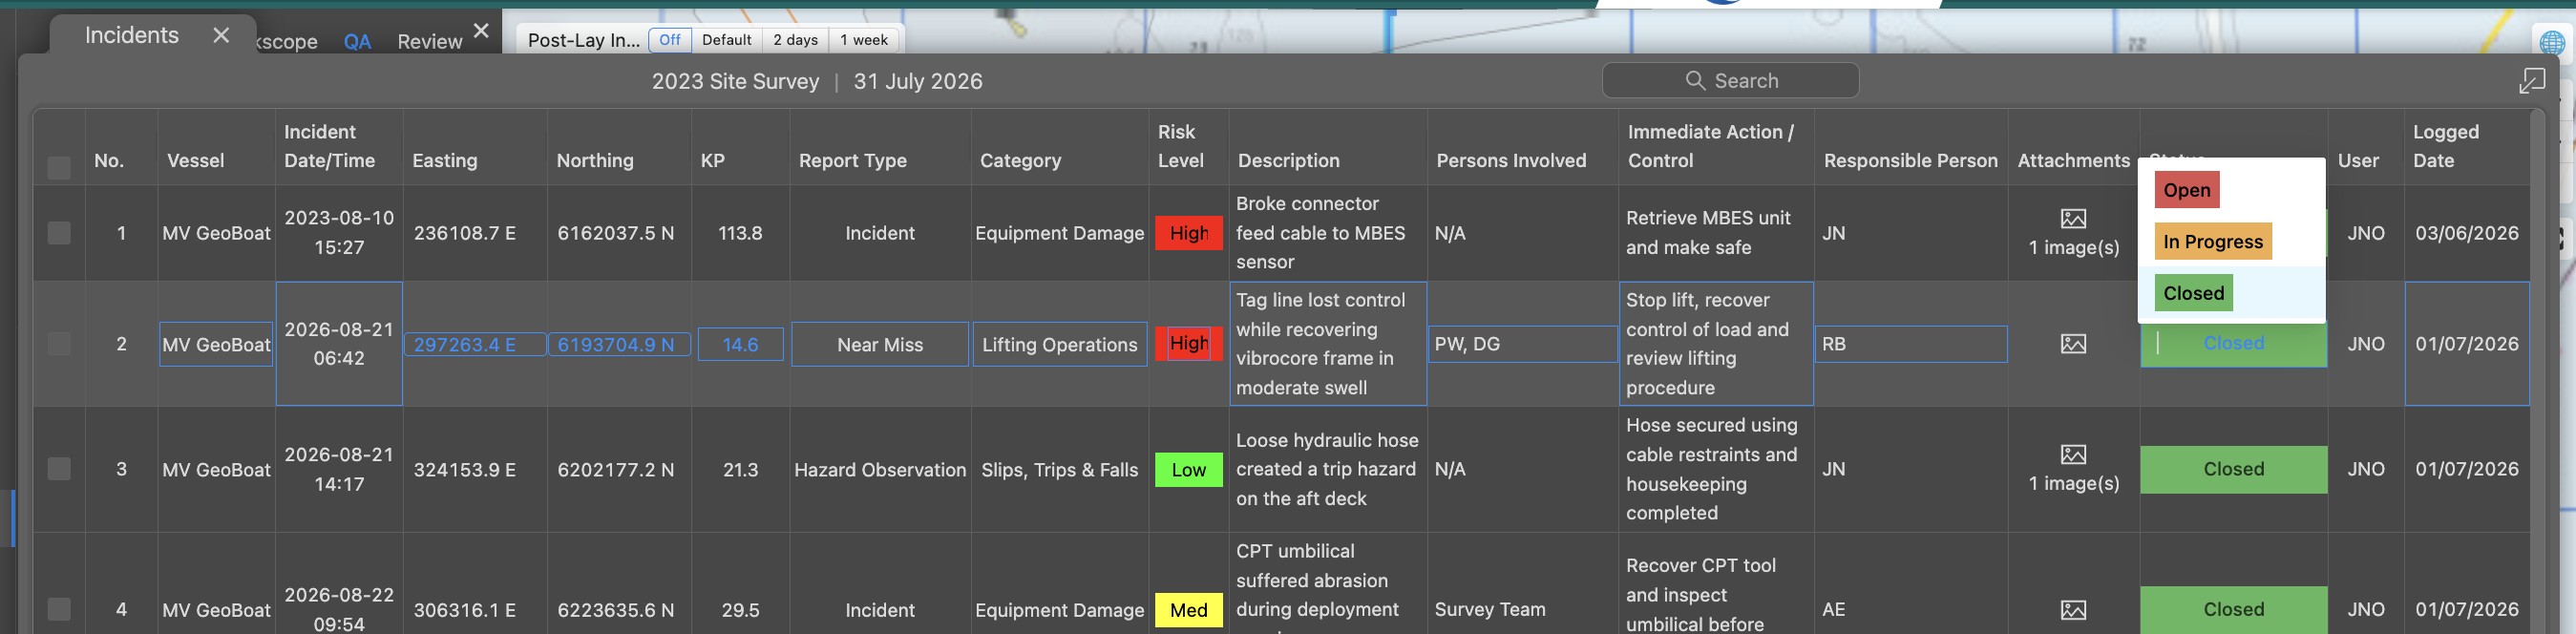
When a health and safety Incident is logged offshore, a record of this can be stored in IRIS.
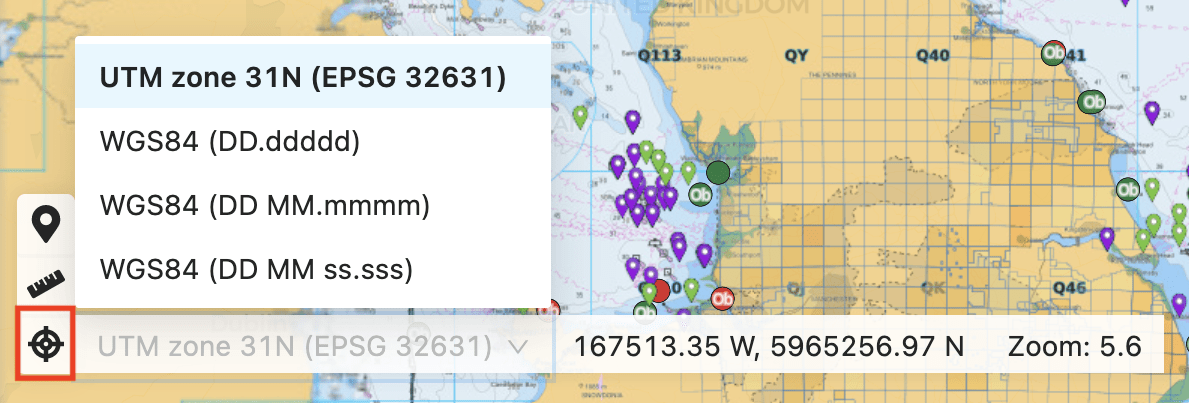
Like other tools the default co-ordinates can be changed from project easting and northing to latitude and longitude by first changing the Co-ordinate system in the bottom left of the map window. When the correct co-ordinates are entered the incident log will appear as triangle locations in a map layer (With a page refresh).
Please fill out all fields but please don't use full names in Person Involved or Responsible Person column. Either refer to initials, positions or teams. Attach relevant images and throughout the job please update the status e.g. Open, In Progress, Closed
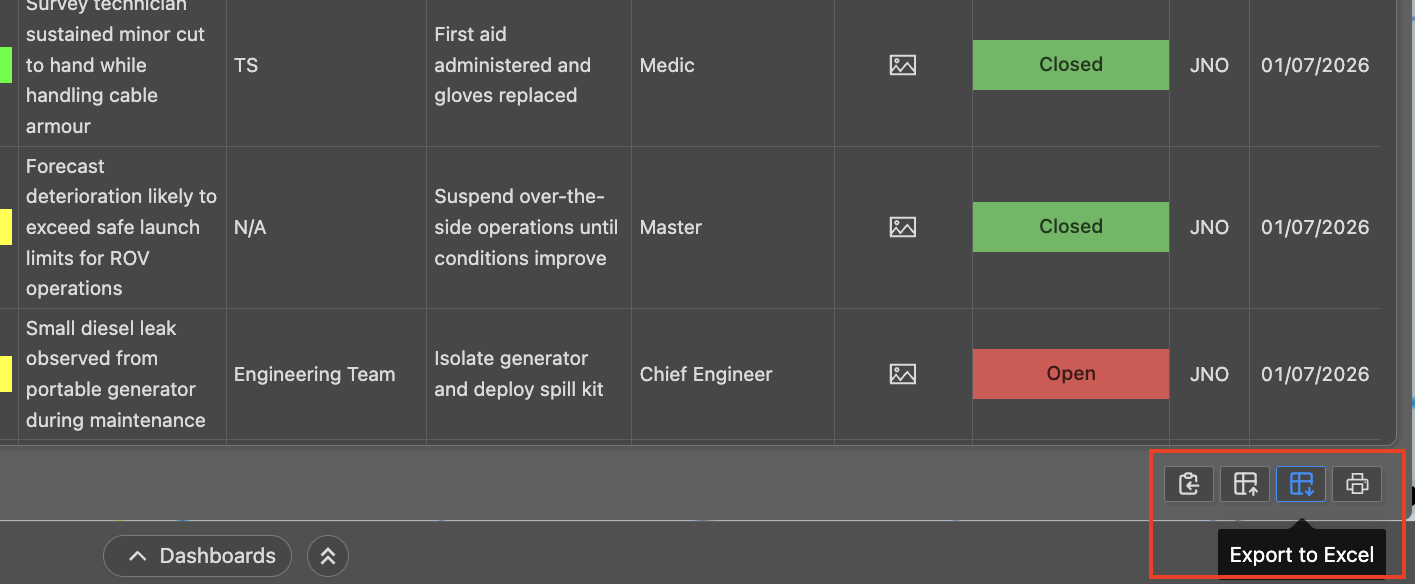
Like other inputs you can import most of the data via excel. Please first use the Export to Excel button (bottom right) to get the right format out, then use that format to fill out the spreadsheet and paste in cleanly using the Import from CSV button (bottom right). Images will need to be attached manually.
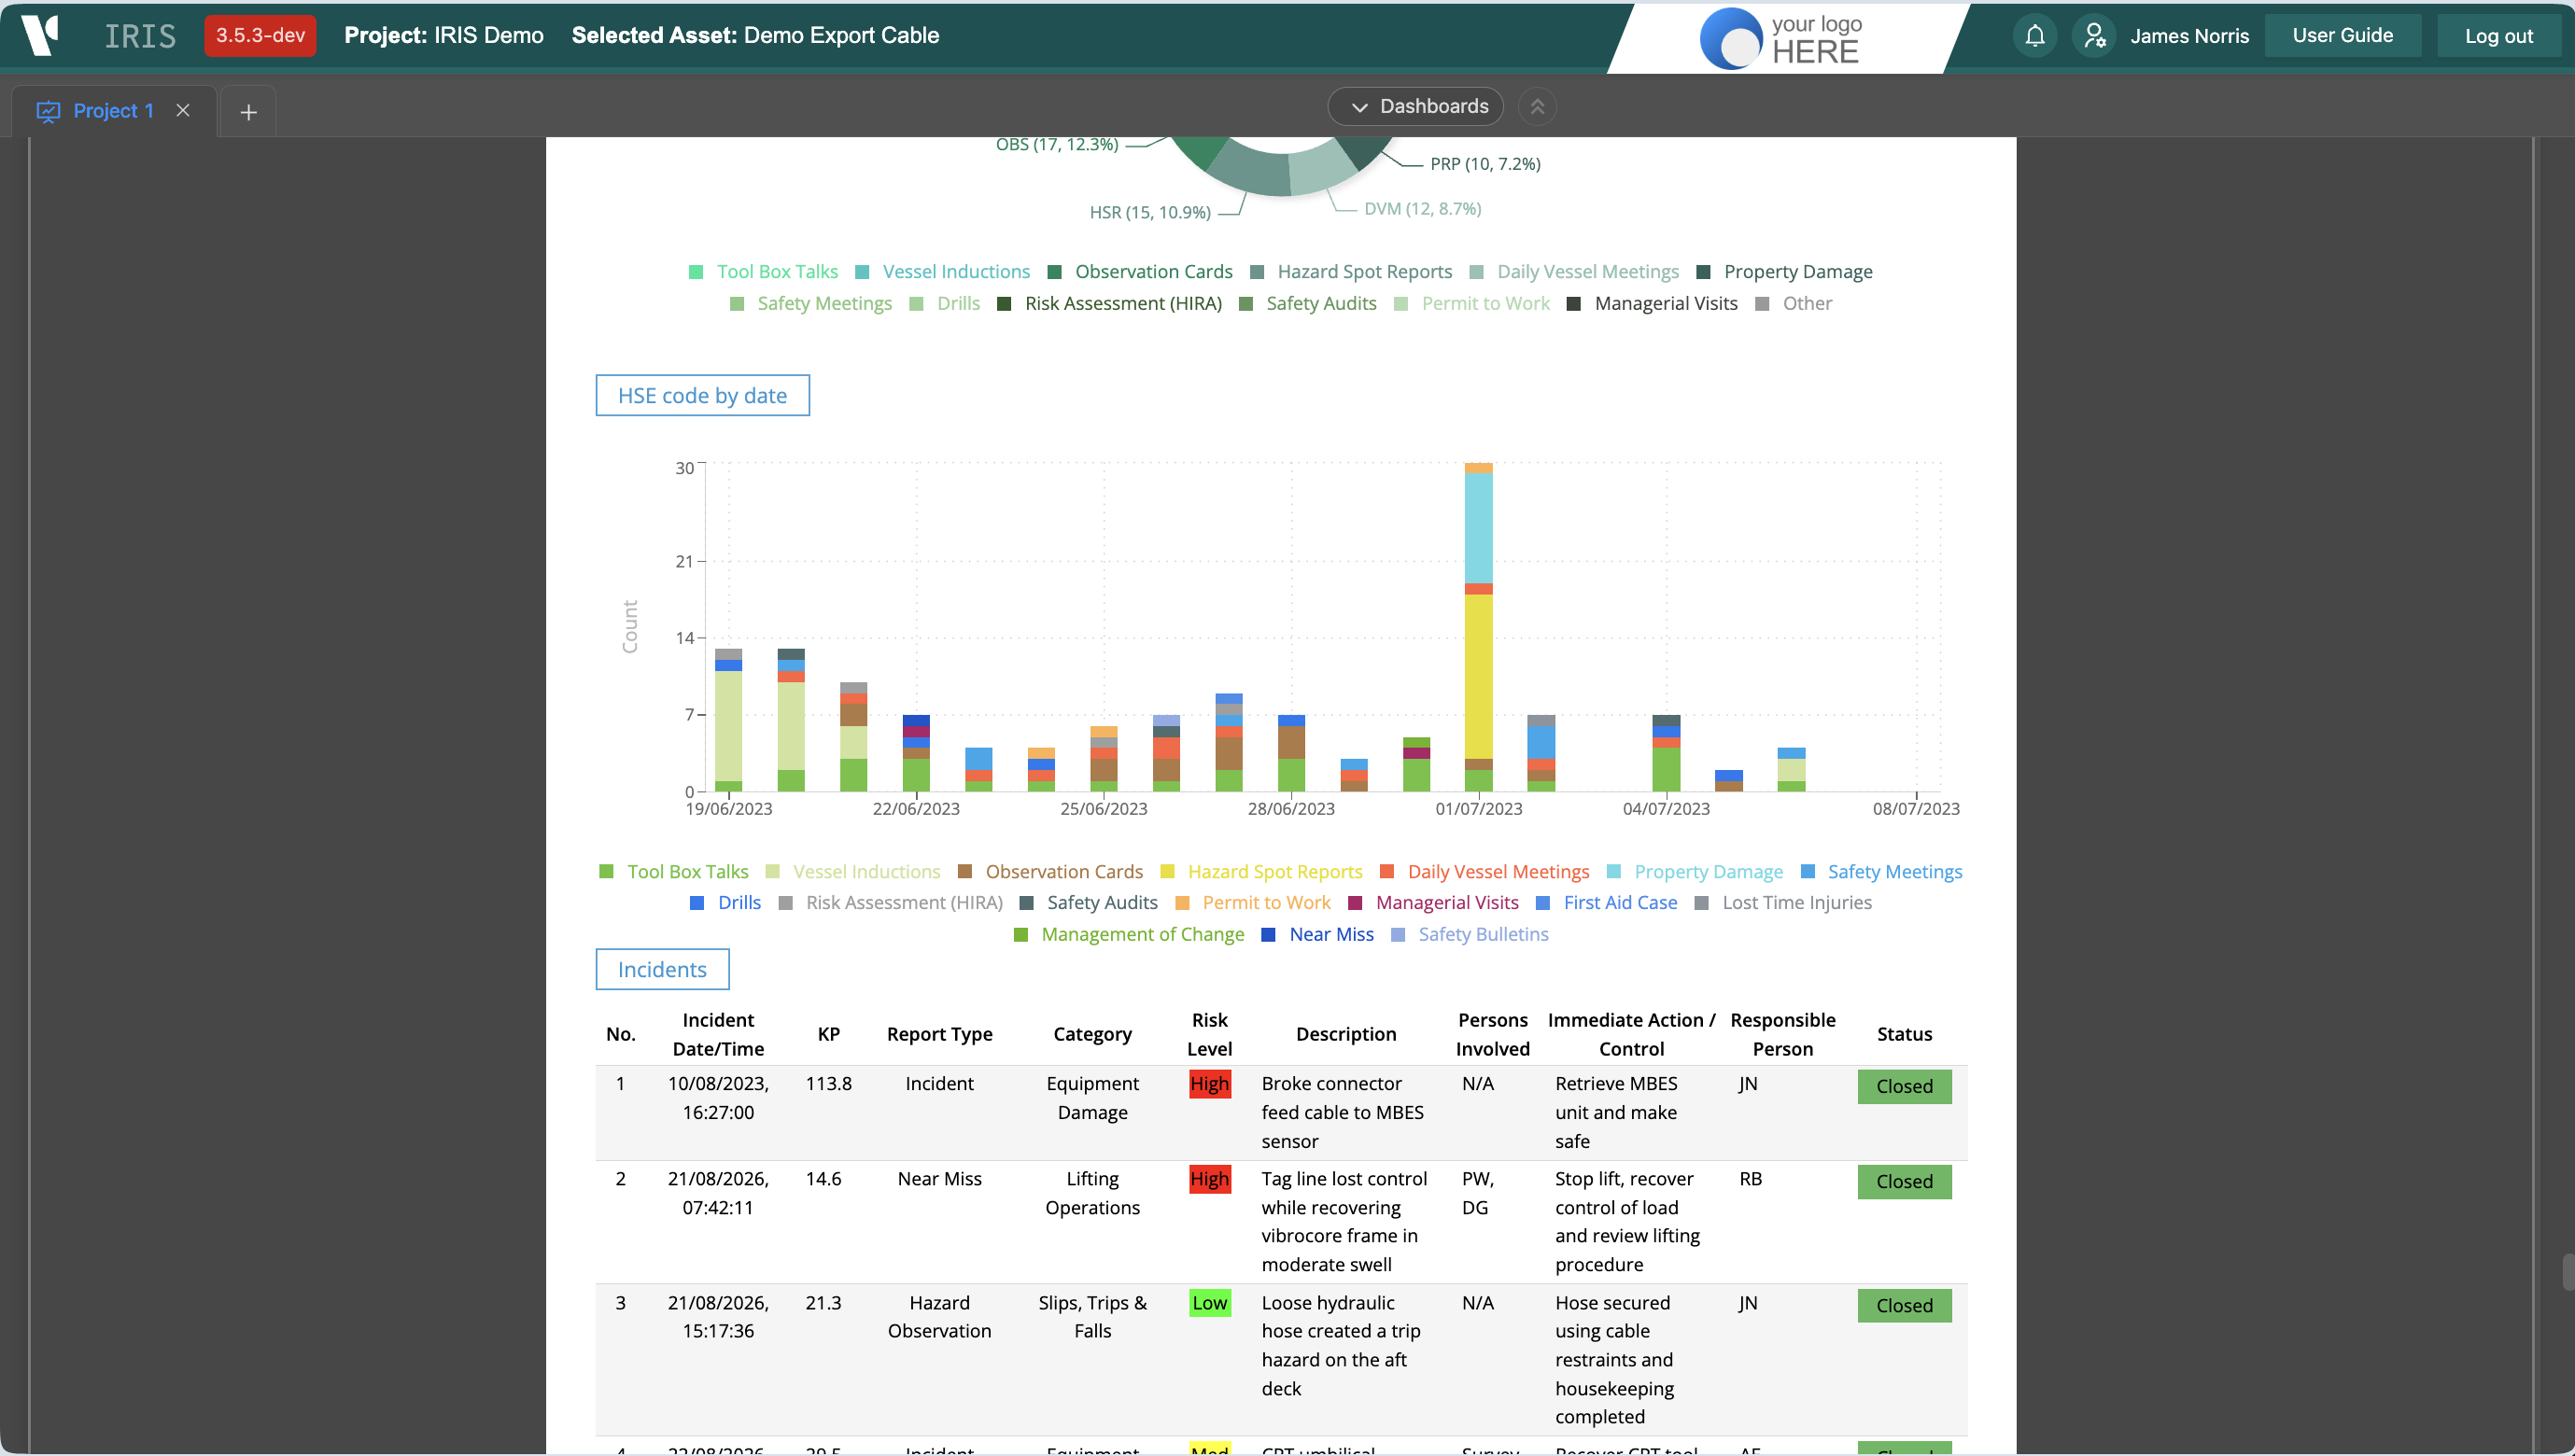
This table will automatically show in the client rep end of job OCR Report and be available in the Project Management Dashboard.
Observations
A primary objective of IRIS 3 is to record Observations within a mechanism that makes them readily subject to analysis and accessible at all stages of future projects from procurement, readiness and execution. Observations are therefore categorised through drop down options. They may also apply to a single vessel or the wiser project.It is encouraged to capture a number of Observations covering all aspects of an Activity.
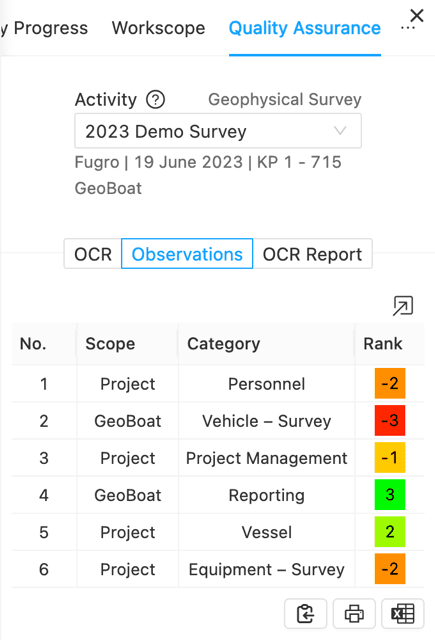
Select the Quality Assurance tab, the Vessel Activity and the Observations toggle. Expand the form and fill out each field in a row. Observations are both positive and negative comments relating to different aspects of survey activities such as work of communications, contractors, vessel or equipment ranked at 3 or bellow. To add an observation, the following data is needed:
- Scope - does this observation apply to one of the vessels on the
Activityor to the project in general ? Select accordingly. - Phase - select the applicable
Activityphase that the observation is relevant to - Category - further select from a pre-populated list of categories
- Detail - further granularity based upon the category selected
- Comments - add your comments describing the observation
- Rank - assess the importance of the observation within a range of
-3 (lesson learnt)to+3 (very positive).
Once you have completed your data entries, click the Submit button at the foot of the form. The data can be subsequently edited and updated in the same manner as described above
For detailed information and user guidance on entering quality assurance data see the Quality Assurance section on data entry.
OCR Report
The OCR report section allows for a report to be built by pulling data from the Activity and Work Scope data and supplementing this with additional text and comments relating to various aspects of the operation. We encourage you to fill this out throughout the activity to reduce time at the end of the job creating the final report. Edits can be made to sections already submitted at a later date.
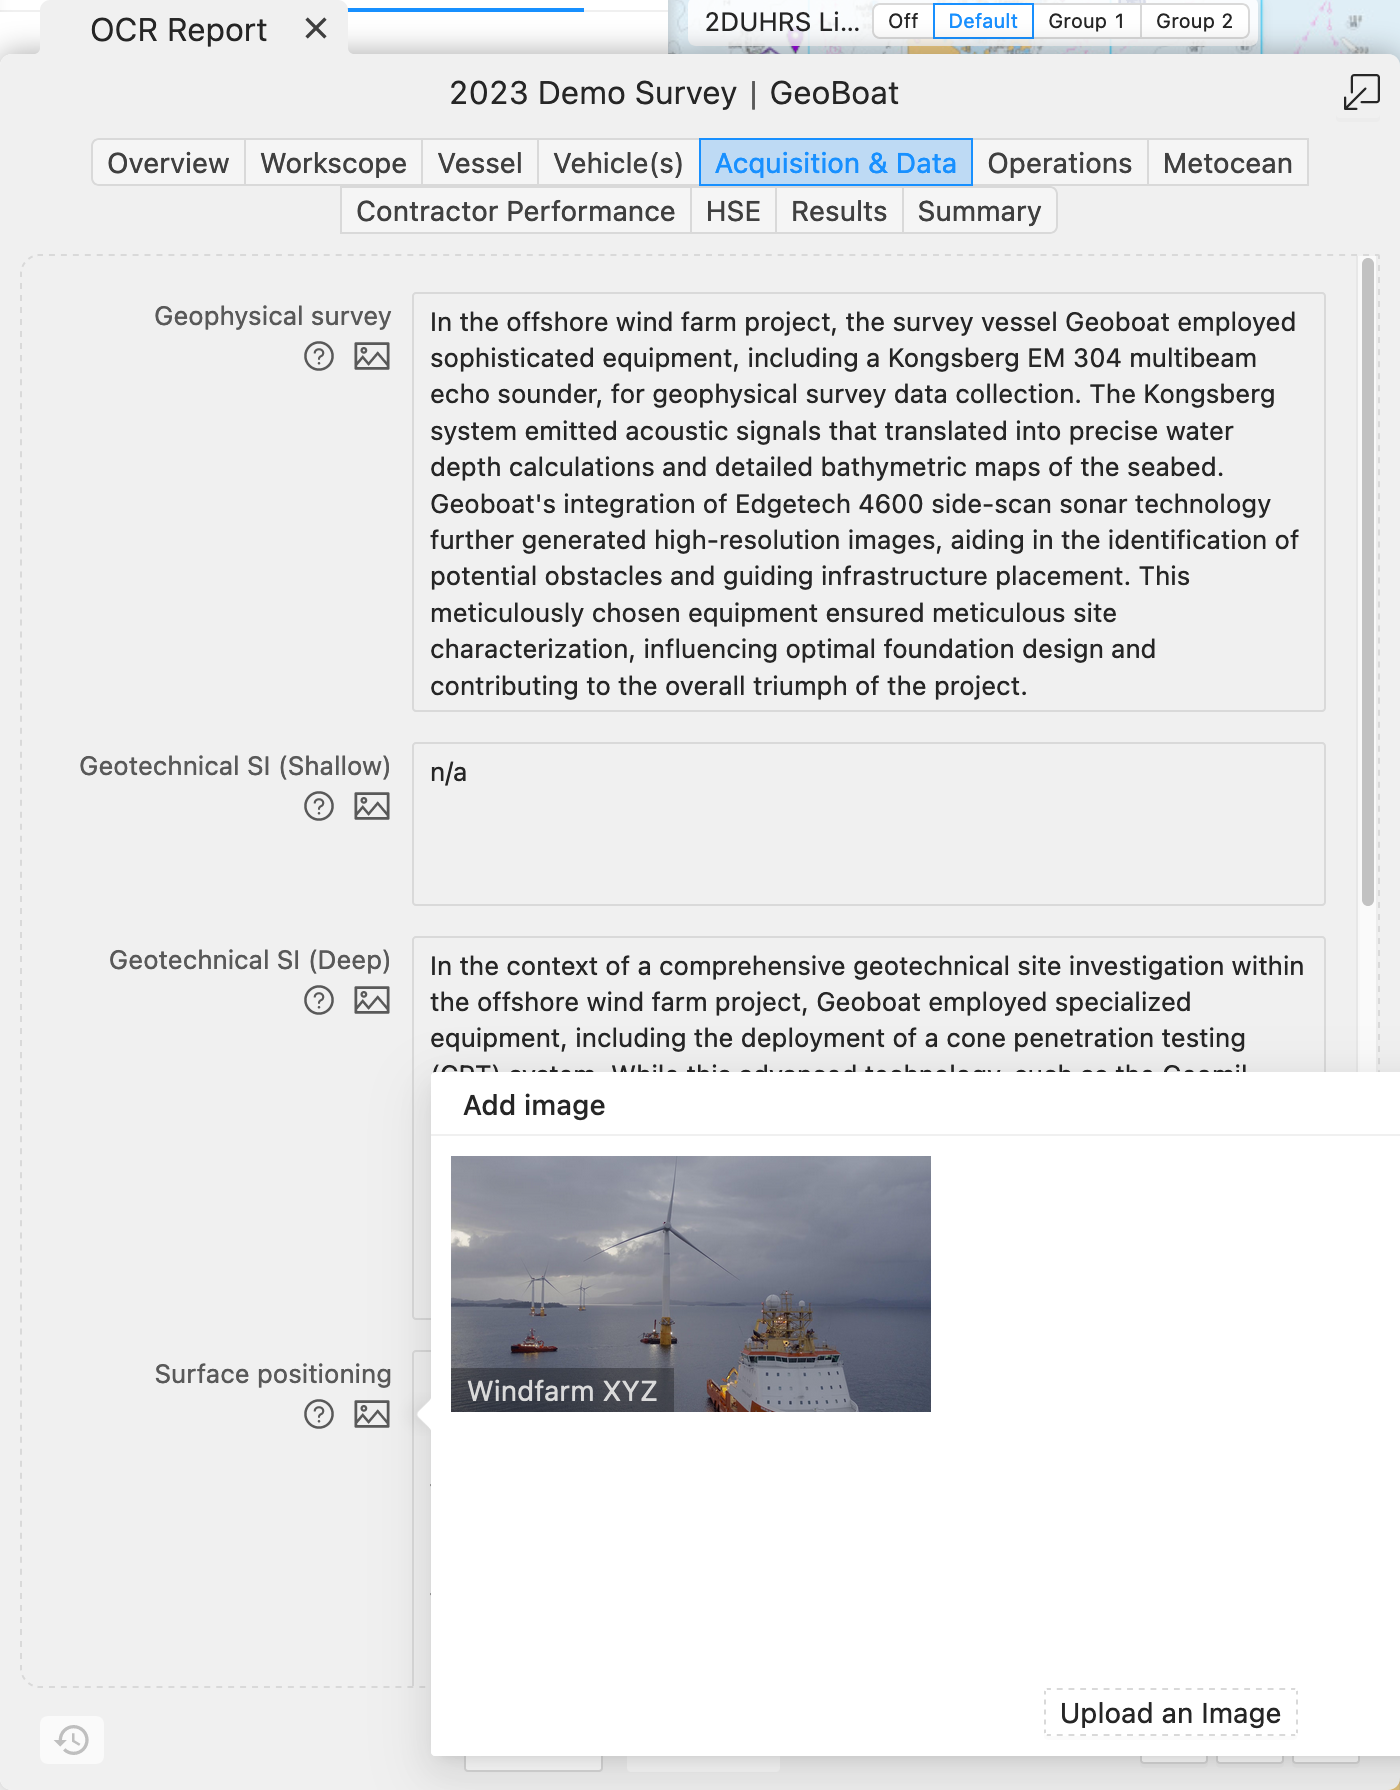
Toggle through each of the tabs that break down the relevant information that is included, and enter the relevant comments into each text box. The form can be expanded (top-right) and the text boxes will continue to expand with no limit on the word count. Formatting may be lost if copy text from an different software (e.g. Microsoft Word) so be aware when using bullet points, subtitles or formatted text (Bold, Italics or Underlined).
Not all sections within the OCR Report will be relevant to the Activity so place a N/A within these text boxes to show it hasn't been missed and can be removed during the submission of the final report. Once complete, click Submit and the text will be formatted and combined with the project data.
Images can now be added through the Image tab. 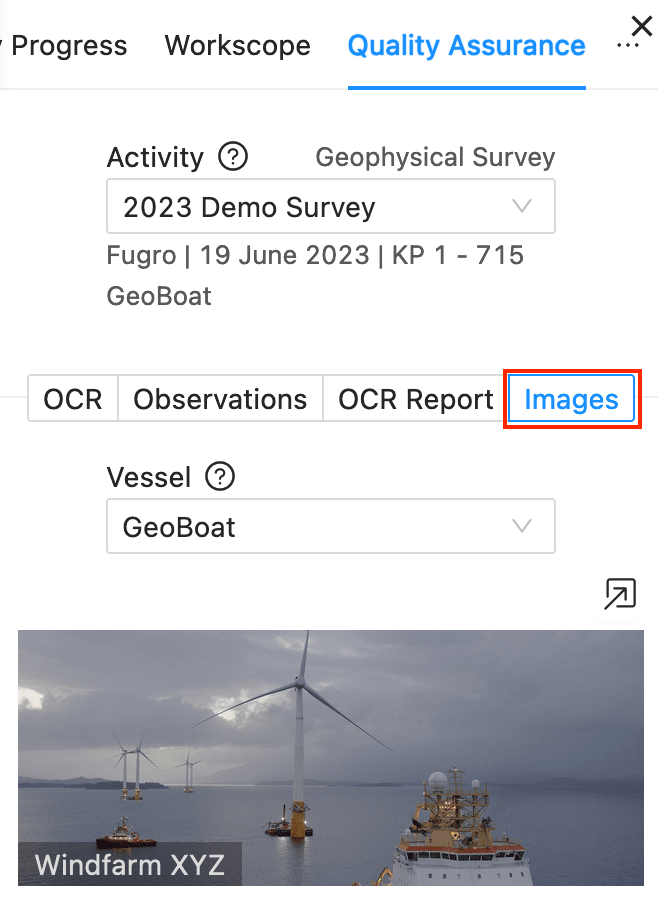
In this a file can be loaded in through the file explorer, with text boxes for the file name, title and description of the image.
Images can then be linked to a specific location within the OCR Report form though the small image icon beside each text box. The image will then be referenced within the selected text box, but will appear at the end of each sub-section of the OCR Report.
For detailed information and user guidance on entering OCR Report data see the OCR Report section on the data entry.
Review
This section provides visual feedback that allows a user or project manager to check Data Entry input to ensure everything is up to date and no parts are missing.
Simply select Activity and Vessel from the available drop downs to see status and info for each Data Entry section. Under each heading there will be a few checks which show a cross, question mark or tick based on predetermined validation rules along with a ? hover which provides more detail.
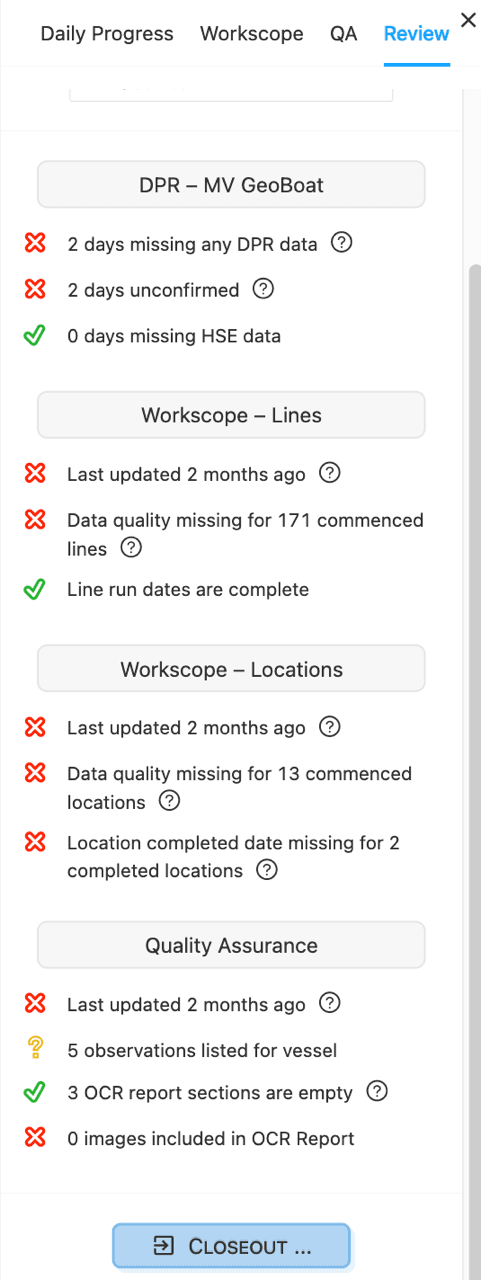
Typically this will include checks like:
- Is there any missing DPR information?
- When was something last updated?
- How many sections have been filled out?
This should aid and remind you of the various elements to update within the Data Entry module. Project Managers will have the ability to close out the activity from this page which will disable Data Entry for that activity and apply an end date.
Activity Completion
The IRIS support team will always be on hand to assist with data updates or any queries. It is really important that everything is updated on a daily basis to provide maximum value to the client and a near real-time understanding of what is happening offshore. Once all the data is filled in and you are ready to close out contact the team and they will publish a completed OCR report which will include all the information entered along with project information and metocean graphing. If you boarded with a Vysus tracking device please make sure this is demobilized with you unless the work is continuing.