
Project Manager Guidance on using IRIS
Project Manager Walkthrough
What is IRIS
Designed for the offshore energy and cable sectors, IRIS 3 is the newly released version of our successful IRIS mapping and project management web application used widely in the offshore industry over the past 8 years. IRIS 3 is focused upon offshore survey, construction and subsea inspection projects and associated data and uses the latest web mapping frameworks and secure cloud delivery platforms.
IRIS 3 allows clients to bring all projects, project phases and project data into a single portal for visualisation, assessment and analysis. The IRIS 3 CableQC module allows for the management of cable data and the determination and visualisation of assessed risk along the length of the cable.
For more info see the page What is IRIS.
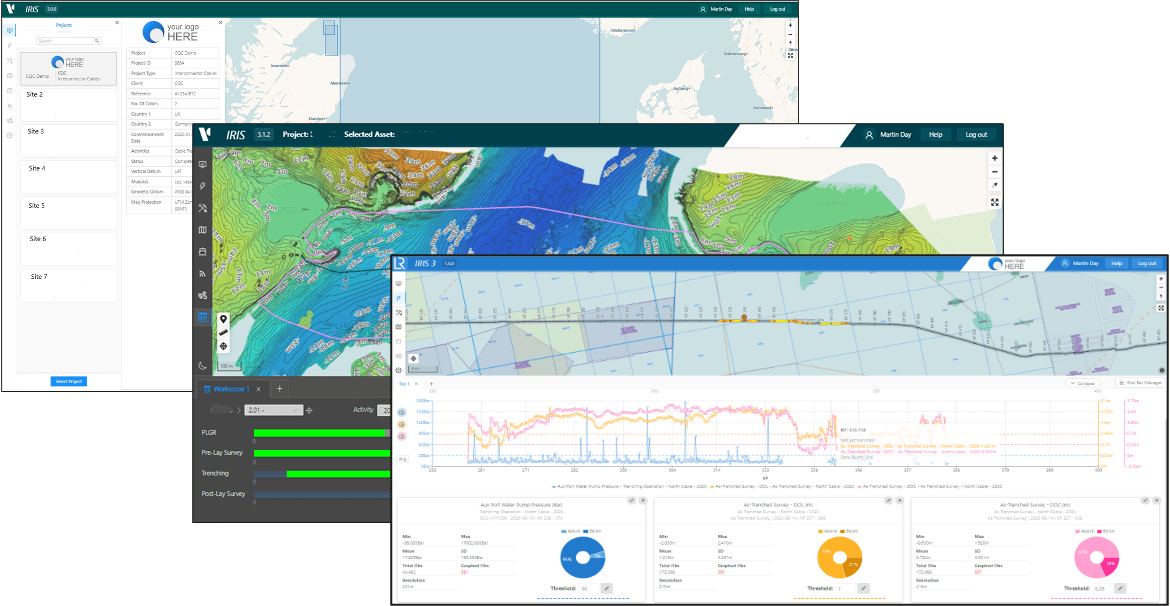
IRIS Project Performance Objectives
A fundamental objective for Vysus Group is to capture offshore project performance data as the project progresses, in a way that puts structured data and information directly into a database server.
By doing this, through the prism of a web map platform we can:
- Achieve the closest 24/7 visibility to project progress, status and forecast for our Project Managers our Clients and their Stakeholders, supporting efficient decision making associated with the work scopes, schedules and budgets
- Deploy tools and analysis to identify issues, trends and performance indicators for individual contractors, vessels and equipment across single and multiple projects.
- Auto generate weekly or monthly project progress and outlook reports
- Auto-generate consistent OCR reports
- Maximize the significant value of 'Observations' in a way that can be readily recalled, analysed and grouped across multiple projects
Keeping IRIS Up To Date
In order to get the most out of IRIS, treat the IRIS team like your junior project manager and always keep us informed of timelines and upcoming surveys. Likewise, we keep our reference data up to date but if project planning GIS data is available please send across. We will do most of the work and provide guidance along the way but sharing information and updates, will allow us to ensure everything is in place, in a timely manner and all users have confidence the latest is showing.
We've created an initiation folder containing a spreadsheet which outlines the information we need at various stages of the project: Download. Once filled in with relevant files dropped in the various folders, please send this to the IRIS Support team.
Setting up a New Project
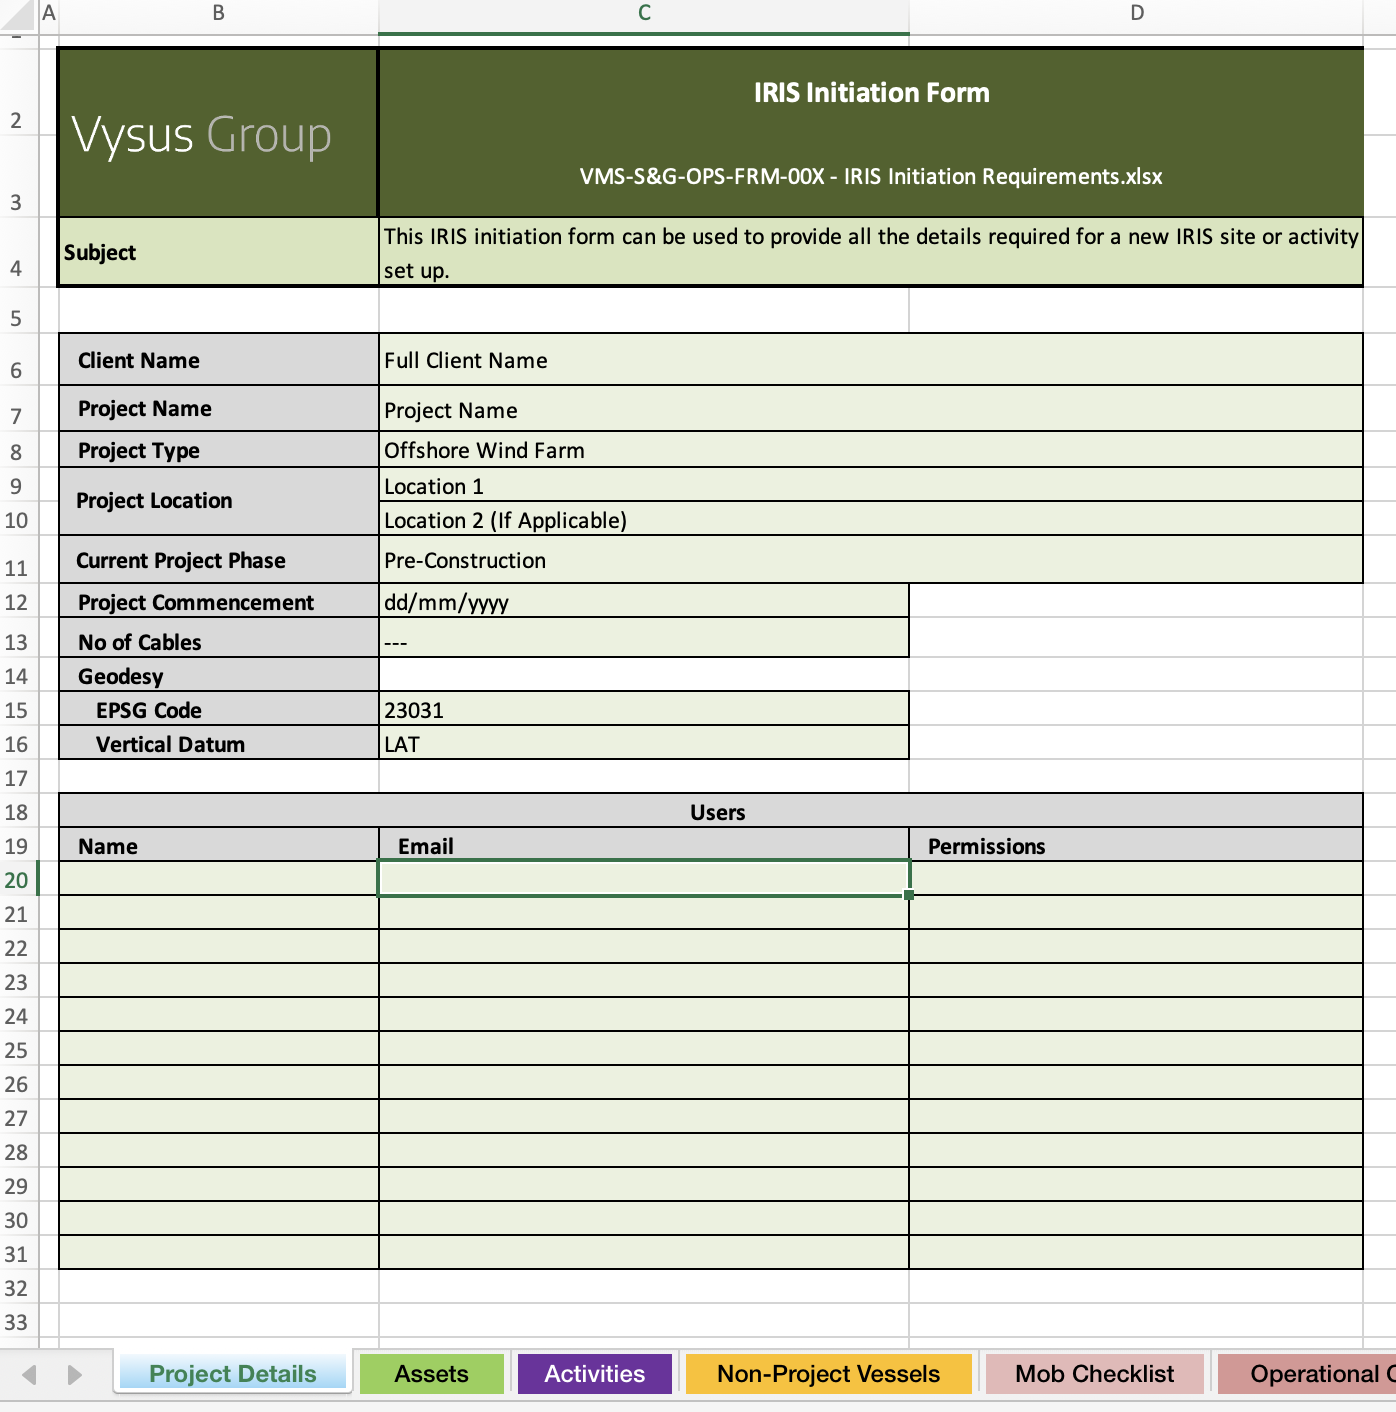
The first sheet Project Details outlines key details for setting up a completely new project e.g. New Offshore Cable Installation. The co-ordinate system is an important factor and any supporting GIS files to show project locations should be sent.
User Accounts
The above also contains a table for providing a list of initial users to have access to the system. For any subsequent user additions just send us an email with their name, email, permission level and expiry date.
User accounts can have different permission levels on each project and can be customized on request. We typically follow the below levels:
- Contractor - For third party consultants or contractors with limited view of just the mapping layers and vessel tracks.
- Standard - Can view everything except Cost Module and cannot make any permanent edits.
- Client Rep - Same as standard but can input DPR, HSE and information for the OCR Reporting.
- Project Manager - Can make additional edits such as adding new DPR activity codes or setting vessel weather limits.
Assets
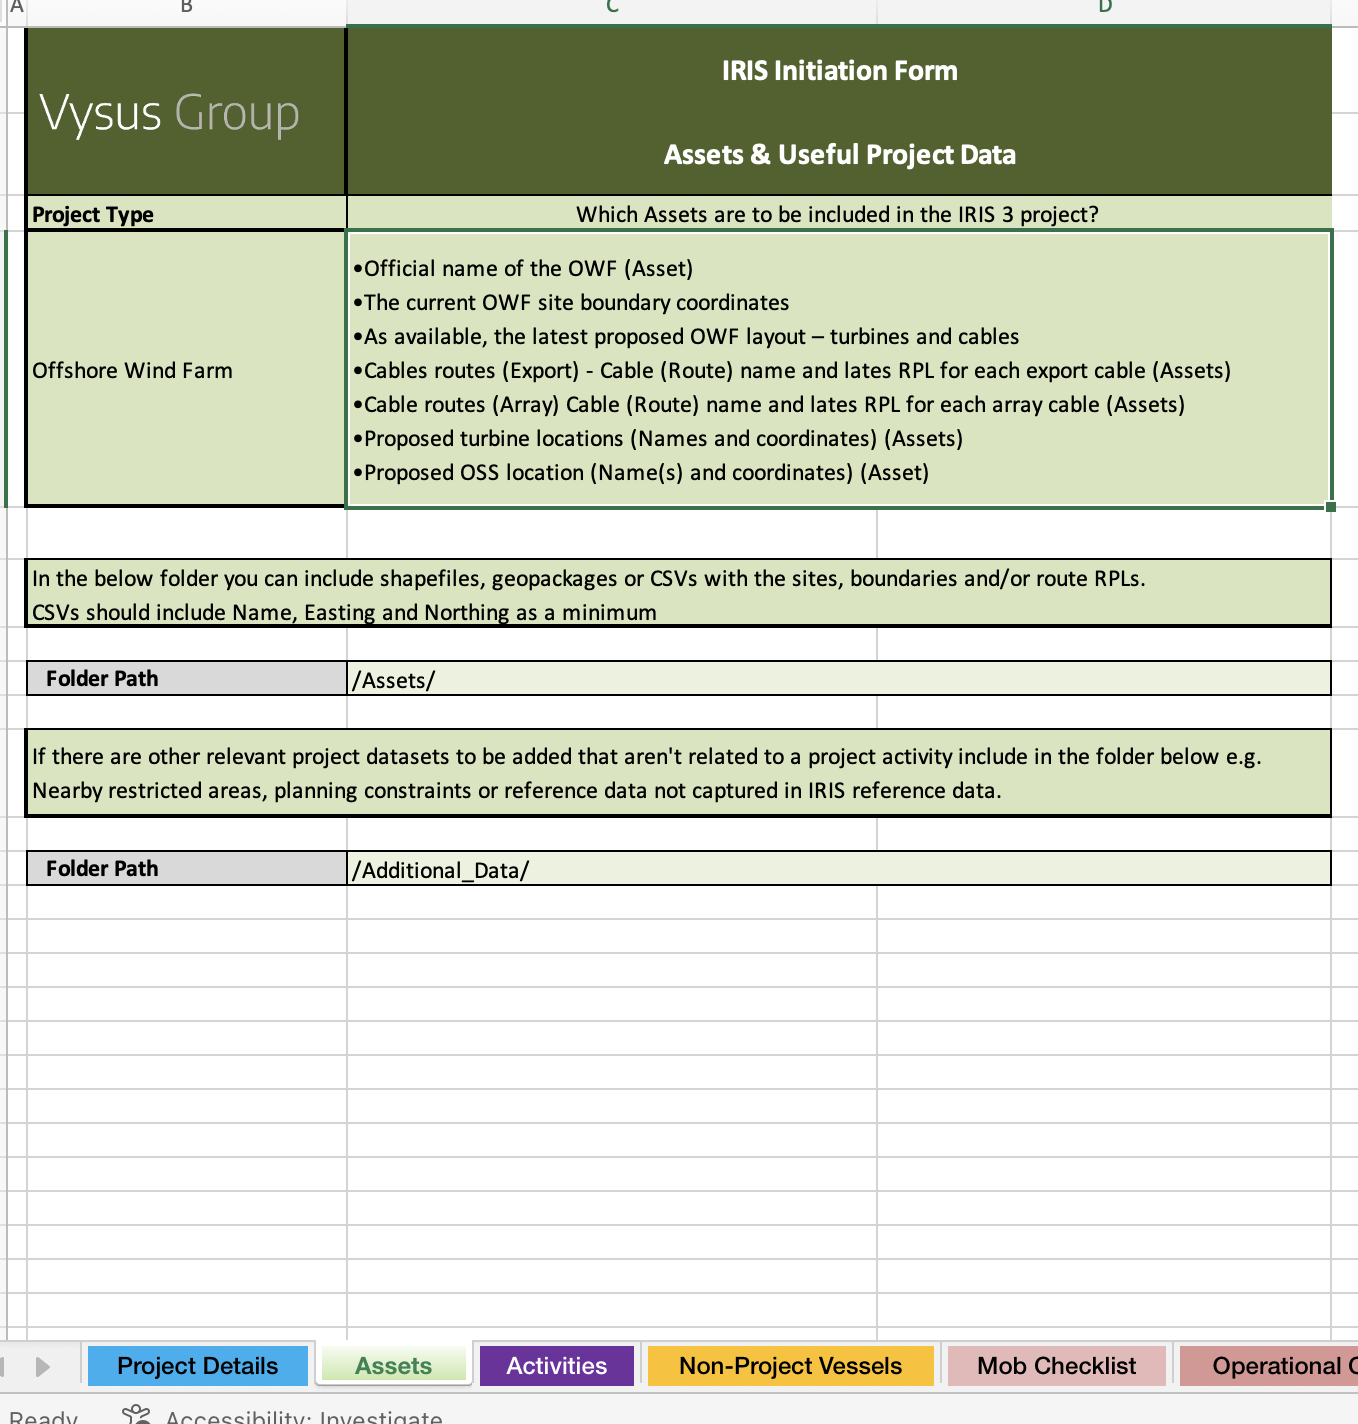
In IRIS we refer to assets as the windfarm sites, cable route or platform location. The main driver of how the rest of the IRIS site flows. For instance survey activities are linked to the parent asset and can be filter as such.
The Assets page in the spreadsheet asks for basic information and shows you where to store data related to it in the folder we provided. If it's a site we need the boundary co-ordinates or GIS data or if it's a route, we need the route position listing or GIS data.
New Survey or Construction Activity
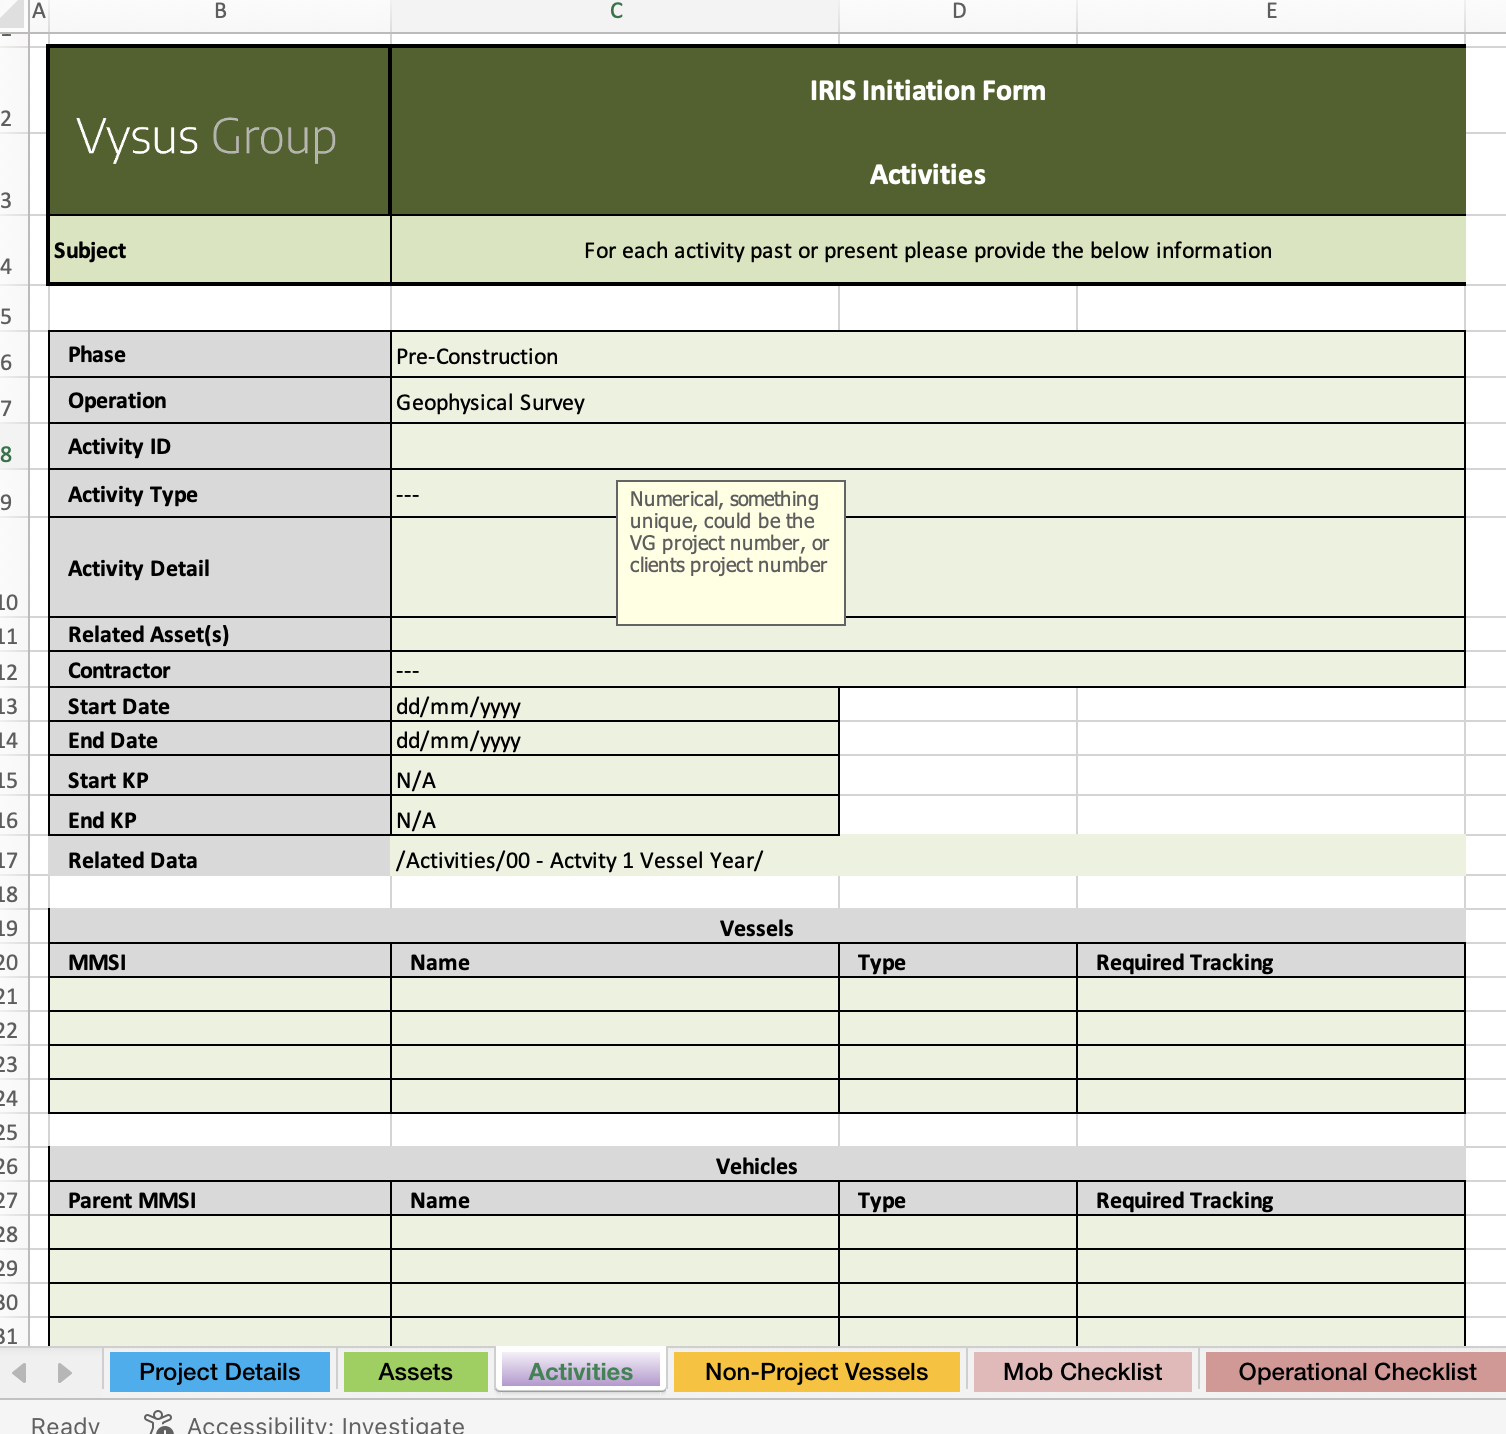
We refer to things like surveys, installation campaigns or geotechnical site investigations as Activities. The activities page can be duplicated for any amount of new or historic activities to be added. It includes key activity details along with vessel tracking requirements. If workscope data such as survey lines or planned geotechnical locations are available, please send spreadsheets or GIS data along with this form. Likewise email the team with documentation relating to the activity (such as RAMS, Mob/Cal Reports, vessel data sheets, Vessel Assurance info) to link this information.
Checklists
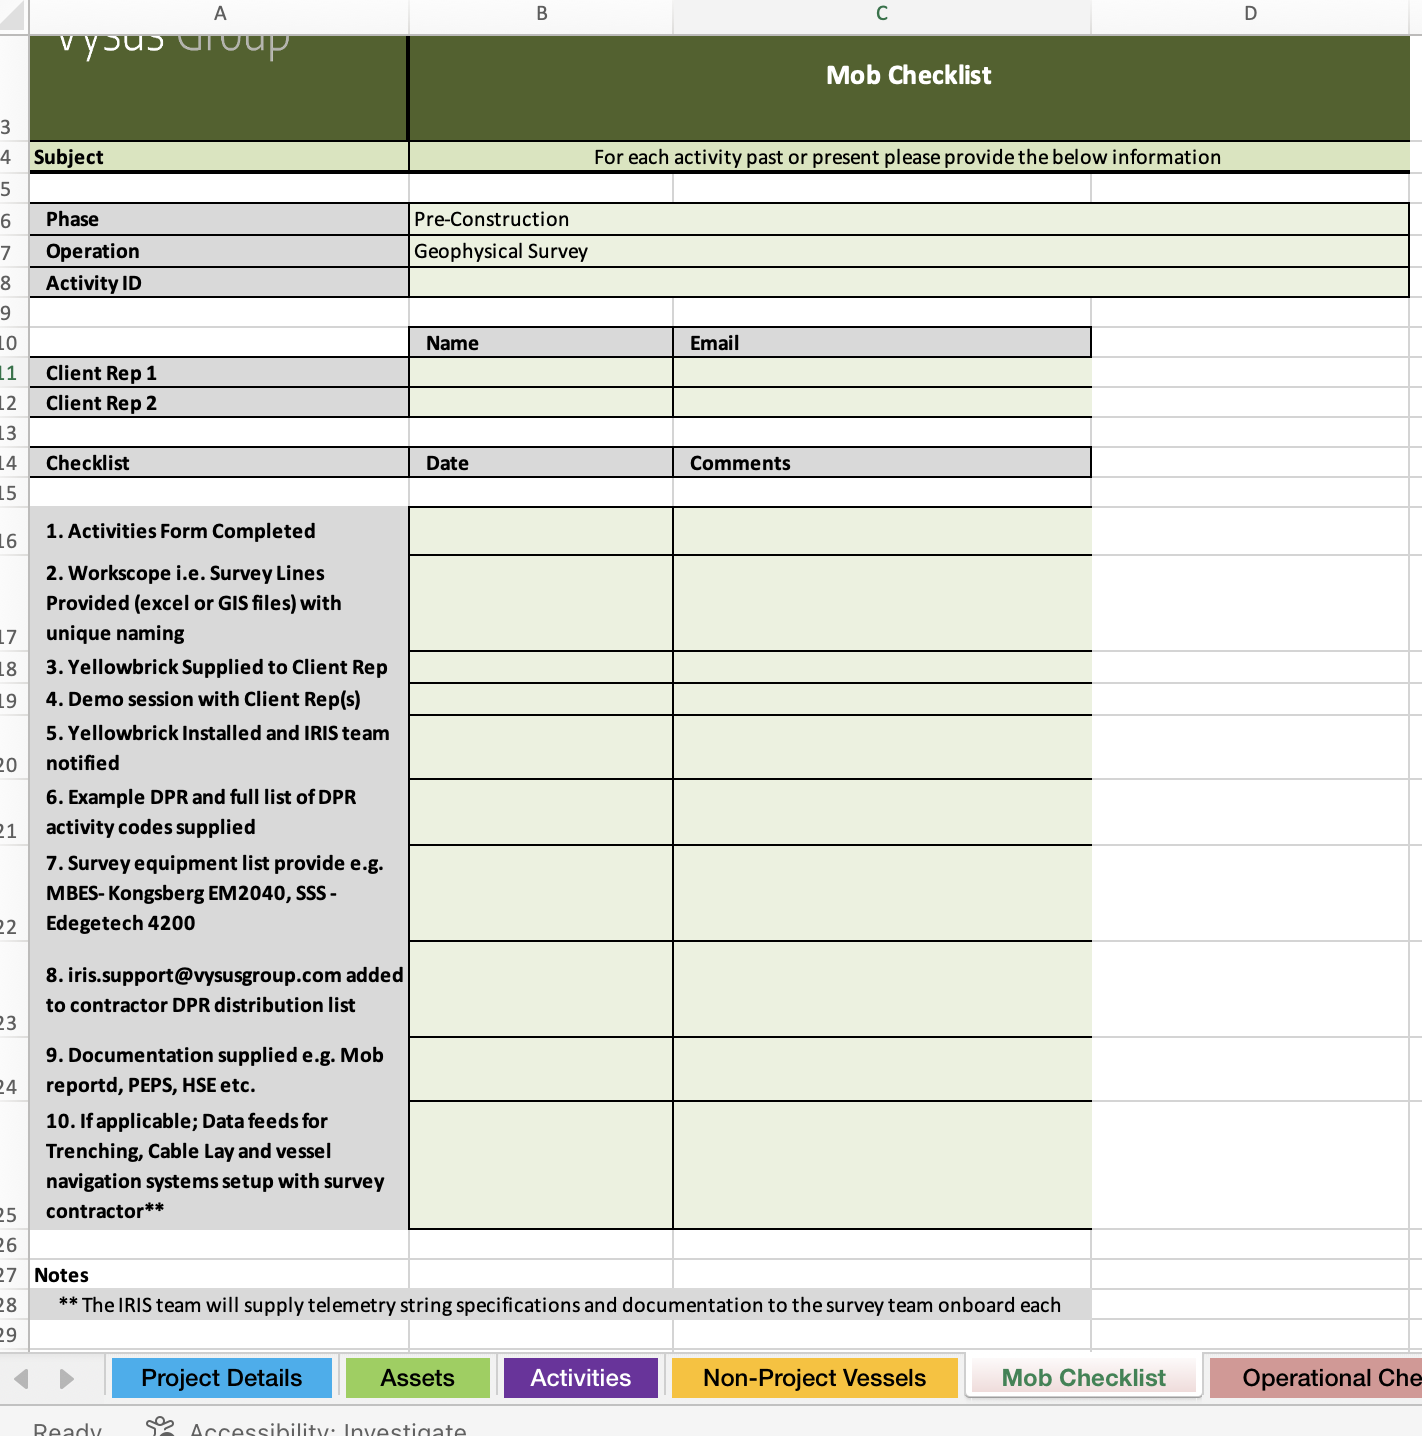
Checklists include mobilisation, operational and demobilisation tasks which help guide requirements at each stage. We will typically be involved in most of these checks. The most important consideration is when one of our handheld satellite GPS trackers is needed. Please make sure enough time is given for us to post a unit to a client representative or a member of the team going to mobilisation. Likewise at the end of the job, this needs to be taken off the vessel and posted back to us.
Live Data Feeds
We can take live positional and vehicle data feeds from things like Trenchers or USVs. Either these can be retrieved from the contractor directly where they ping messages to our server or we can install a VNode system onboard, which harvests and backups data from their onboard systems before relaying it to our IRIS servers. For more information get in touch.
If weather services have been purchased from a provider like StormGeo, MetOffice or MeteoGroup we can most likely feed the data directly into our Metocean Module. Alternatively if only PDFs are provided we can automatically place them in the documentation, alongside DPRs in the Activities Module. Contact the IRISteam to get this set up.
Contractor Deliverables
Preliminary survey deliverables such as bathymetry, side scan sonar data or field logs can be loaded into the system during operations on request whenever data is made available. Speak to us to set this up.
Final deliverables typically take 6 months or more to be reviewed. Once these are ready please discuss with us and send us all results excluding raw data. Typically contractors should follow standard data formats for GIS deliverables such as IOGPs SSDM but we can work with most formats.
For further guidance we have our standard specifications which can be downloaded here. Please send any accompanying documentation such as a DPRs, final reports, HIRAS, RAMS, charts and listings to add to the documents pane.
Getting Started
Access the IRIS site at the following web address https://iris.vysusgroup.com and log in to the IRIS site using your pre-issued username and password. Once logged in there is a comprehensive user guide accessible from the right hand side of the top bar:

Your permissions profile will be restricted to your current projects.
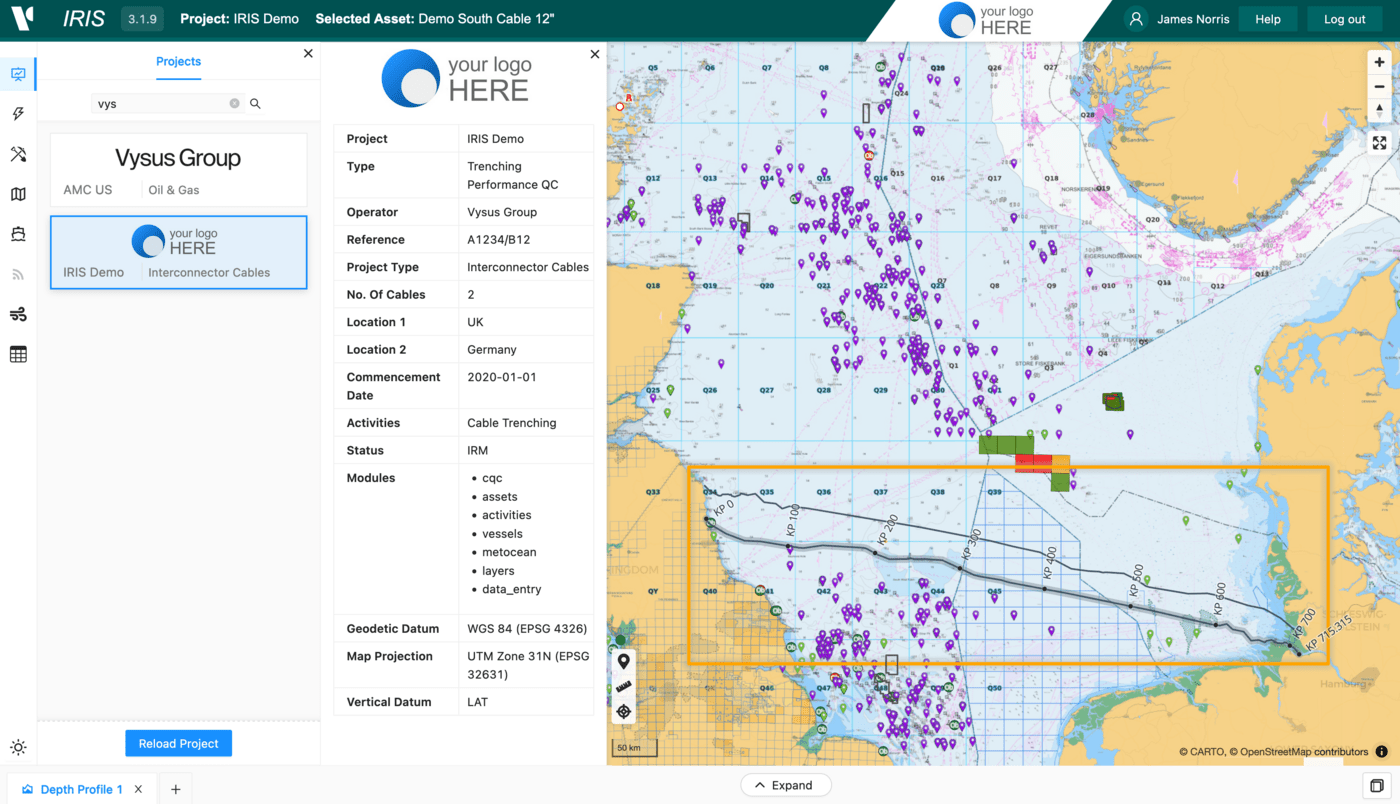
Use the Project Selector icon to select the project from within the Operational tab. Click Load Project to display the project.
Accessing Features and Functionality of IRIS
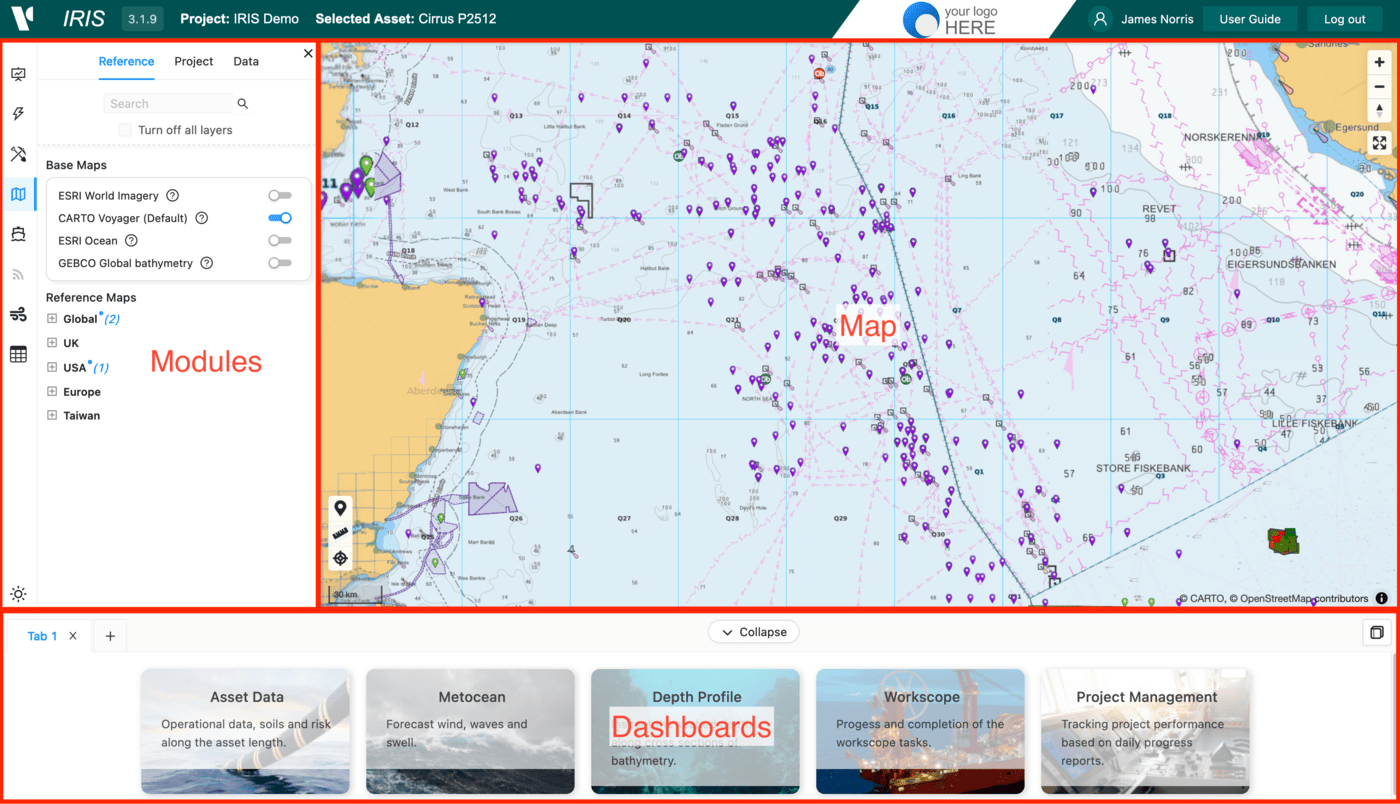
The IRIS 3 application is structured around modules, accessed via the icons within the vertical bar on the left side of the portal and dashboards along the bottom.
The philosophy, features and functionality of IRIS 3 are fully described within the rest of the Userguide and modules through the links below:
Projects Module- Select project from those availableAssets Module- Select relevant infrastructure assets within the projectActivities Module- Sequential organisation of all offshore project activitiesData Module- Select data layers for display on the mapVessels Module- Real-time and replay of vessel positionsTelemetry Module- Digital data streaming from offshore vesselsMetocean Module- Maps and plots of forecast and hindcast global metocean dataData Entry Module- Offshore project performance and status data entryCost and Scheduling Module- Project budget and cost tracking data entryPoints of Interest Module- User editable location or line based map layers
Dashboard information can be accessed through the following links:
Asset Data Dashboard- Graphing and databar of time or KP based data along an assetMetocean Dashboard- Graphing of forecast and hindcast weather dataDepth Profile Dashboard- Create depth profiles along a line or assetCable Installation Dashboard- Tracking project activities within cable installation projectsProject Management Dashboard- Graphing and reporting of project activity, HSE and work scope progressCosts Dashboard- Graphing and reporting of planned, actual and forecasted project budget and running costs
The main focus for Project Managers is the project management dashboard. Here you can see and download information from current and previous survey campaigns such as DPR statistics, HSE incidents, workscope progress and the client reps observations and reports.
Modules and dashboards related to Costs and Metocean might also be particularly useful.